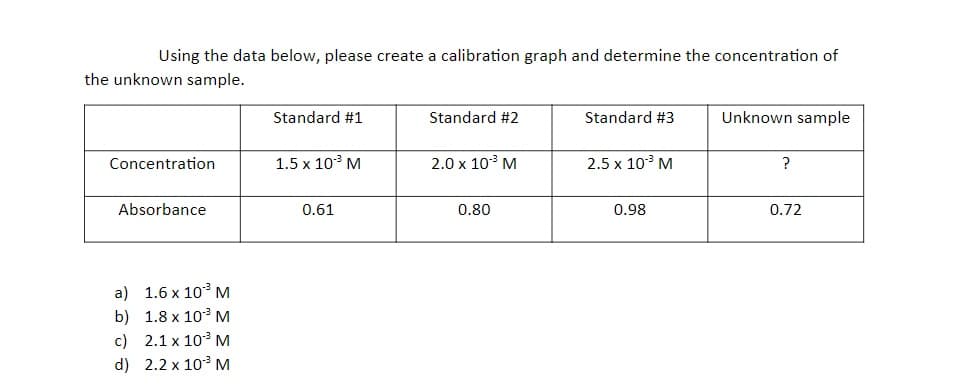
Using the data below, please create a calibration graph and determine the concentration of the unknown sample. Standard #1 Standard #2 Standard #3 Unknown sample Concentration 1.5 x 10³ M 2.0 x 10° M 2.5 x 10 M ? Absorbance 0.61 0.80 0.98 0.72 a) 1.6 x 10 M b) 1.8 x 10 M c) 2.1 x 10³ M d) 2.2 x 10³ M


Q: 4. You prepare several dilutions of an unknown compound. You measure the absorbance of each solution…
A: According to Beer-Lambert Law: where A = Absorbance, b = path length and c = concentration The…
Q: A solution is prepared by diluting 2.81 mL of the blue dye stock solution to 25.00 mL. The measured…
A: The data given is, Given: Volume of blue dye used = 2.81 mL. And the volume of final solution =…
Q: Chemistry Given the following spectrophotometric data, what is the concentration of the sample?…
A:
Q: Calculate the concentration of Cu in the sample by calibration curve using the following data…
A:
Q: To determine the amount of copper and the identity of the copper compound in the unknown sample, a…
A: A question based on general chemistry that is to be accomplished.
Q: To determine the amount of copper and the identity of the copper compound in the unknown sample, a…
A:
Q: A Cu2+ solution obtained by dissolving a 3.1871-g penny in 500 mL of nitric acid has an absorbance…
A: Given : Mass of penny = 3.1871 g Volume of solution = 500 mL = 0.500 L…
Q: Unknown Sample Calculations Sample y (absorbance) = m x (concentration) + b 1 0.200 = 0.1107…
A: A generalized formula helpful in calculating absorbance for any specific solution with known…
Q: Table. Absorbance data for iron standards and flour samples Fe Conc. (mg/L) Corrected Sample…
A: Absorbance of a substance is proportional to its concentration and path length (width of cuvette) by…
Q: QI. 4 litres of water obtained from a borewell in Vellore contains FeSO4 = 30.4 mg; CaS0 = 13.6 mg;…
A:
Q: To quantify the Cadmium content in a water sample, 5 aliquots of 10 mL were taken, adding to each…
A: The amount of concentration in the sample can be calculated using the following formula. In this…
Q: Table II Cuvette # Concentration Absorbance 0.50 M 1 1.049 2 0.40 M 0.926 3 0.20 M 0.740 0.298 4…
A: The formula for Beer-Lambart law is given by
Q: A compound X is to be determined by UV/Visible spectrophotometry. A calibration curve is constructed…
A: The light absorbed by the solution is known as absorbance.
Q: You prepare several dilutions of an unknown compound. You measure the absorbance of each solution at…
A: The graph for concentration-Absorbance is shown below in which slope of the curve is determined.
Q: 1. Fit a straight line to the following data points using excel program to obtain the concentration…
A: Beer's Lambert's law :
Q: 1. Consider the following data set. Concentration, mg/L 0.100 0.200 0.300 0.400 0.500 Write capital…
A: We have find out slope, intercept and concentration of an unknown sample with an absorbance reading…
Q: 2. Concentration of metal ion. Absorbance of metal ion in solution 0.316 Concentration of metal ion…
A: 2. Given: Initial Volume of Unknown Sample = 20 mL Volume of Final diluted sample = 25 mL…
Q: A. Copper sulfate pentahydrate is often used to teach students about Beer’s Law by making a standard…
A: Here we are required to volume of stock solution required to prepare various diluted solution for a…
Q: The following data were obtained for 1.00 cm samples of a particular chemical. What is the…
A: In the given graph, x-axis represents concentration of the sample. y-axis represents absorbance of…
Q: 7. Fill the absorbance value below; Path length % T 0.2 0.4 0.6 0.8 1.0 25 12.5 6.25 3.125 100 50…
A: The objective of the question is to fill the table with the correct absorbance values for the given…
Q: With reference to the following calibration curve, what is the concentration (M) of a solution with…
A: Absorbance v/s concentration graph plot helps to find the concentration of solution of unknown…
Q: Concentration (M) Absorbance 0.0200 0.102 0.0400 0.204 0.0600 0.306 0.0800 0.408 0.100 0.510 An…
A: As per Lambert-Beer's law, absorbance of a solution is directly proportional to concentration of…
Q: Concentration of Manganese in Red Wine 0.6 y = 0.1373x + 0.122 R2 = 0.9986 0.5 0.4 0.3 0.2 0.1 0.5 1…
A: The linear regression equation for the Absorbance versus manganese concentration (ppm) graph is Y =…
Q: To determine the amount of copper and the identity of the copper compound in the unknown sample, a…
A: A question based on general chemistry that is to be accomplished.
Q: Absorbance Volume Concentration ug/mL (mL) of each standard 1 0.000 2 1 0.005 3 2.5 0.010 4 6.25…
A: The linear regression equation Y = 0.0036x + 0.0006
Q: The following Absorbance vs concentration of nitrite graph is obtained for a set of data: y =1.6628x…
A: The details solution for this is provided below in step II.
Q: 4. Using the calibration curve below, what is the concentration of a Cu2t solution which had an…
A: The concentration of Cu2+ can be determined by the below formula.
Q: II. Determination of Total Hardness of Water Source of water sample: Volume of water sample 22.00 mL…
A: Given that, Volume of EDTA solution consumed (V1)=14.06mL Molarity of standard EDTA solution used…
Q: Blue Blue dye stock solution 0.293 M Absorbance at 630 nm 0.00265 Calibration curve y = 0.0833x A…
A: a) Calculation of theoretical molar concentration: MinitialVinitial=MfinalVfinal0.293 M×2.79…
Q: Absorbance vs. Concentration y = 0.2755x 0 0.200 0.400 0.600 1.000 1.200 1.400 1.600 1.800 2.000…
A:
Q: Part 2: Equilibrium Constant Determination Tube Fe(NO3)3 (mL) HSCN (mL) [Fe³+]; (M) 1 1.00.015 5.0…
A: To calculate FeSCN2+ concentration in M
Q: The hardness of water is analyzed using titration. A liter of water sample from tap water found to…
A:
Q: 2. Using the Data and Graph below (with the equation for the best fit line), Calculate the concent…
A: In the given equation Y is absorbance and x is concentration. Given equation, y=1.1429x-0.0007…
Q: The nickel level in a soil sample was determined using AAS. A 3.0 g sample was dissolved in acid and…
A: The calibration curve equation given is, => y = 0.0699 x + 0.015 Where y = absorbance And x =…
Q: Tonic water (20.0 mL) was added into each of two volumetric flasks (100 mL). The first flask was…
A:
Q: 1) Determine the total volume of the standards by using a formula in the appropriate boxes (your…
A: The data is given for absorbance versus concentration of different solutions.
Q: To determine the amount of copper and the identity of the copper compound in the unknown sample, a…
A:
Q: In the experiment "Beer-Lambert's Law and Spectrophotometry", you prepared a calibration plot…
A:
Q: A. Copper sulfate pentahydrate is often used to teach students about Beer’s Law by making a standard…
A: We’ll answer the first question since the exact one wasn’t specified. Please submit a new question…
Q: A sample was analysed for its Calcium concentration. A number of standard solutions were prepared…
A: The plot of concentration will give the relation between concentration and absorbance. If one…
Q: A researcher prepared mixed solutions at different concentrations and measured the absorbances with…
A: A question based on Beer-Lambert law, which is to be accomplished.
Q: Blue Blue dye stock solution 0.293 M Absorbance at 630 nm 0.00265 Calibration curve y = 0.0833x A…
A: a) The stock solution of blue dye has concentration = 0.293 M Since the volume of blue dye taken =…
Q: Make a standard calibration curve wherein the x-axis is the total concentration of standard 1 to 6…
A: A question based on tools in analytical chemistry that is to be accomplished.
Q: Using the equation for the calibration curve below calculate the concentration of a CUSO4 solution…
A: Given , the equation of graph .
Q: Using the calibration data above for the dye solution, what is the dye concentration in a solution…
A:
Q: Part 2 - Dilution series Concentration (M) Absorbance 30 55 75 85 92 0.100 0.0500 0.0250 0.0125…
A: Given
Q: explain what the results of this experiment are and the purpose Table 2 Absorbance vs CoCl2…
A: Purpose of the experiment is to draw the calibration curve from standard data , to know then find…
Q: A standard curve for glucose analysis was prepared.The slope (m) was found to be 1.341 while the…
A: Given: Slope(m) = 1.341 y-intercept = -0.333 Absorbance (y) = 0.151
Q: www 200 180 S 160 140 120 100 (CDGL3) 80 t 60 q q 20 PPM 0
A: We are given C-13 NMR spectrum of the unknown molecule. We have to analyze the C-13 NMR spectrum…

Step by step
Solved in 2 steps with 2 images

- From the following data, calculate the concentration of the analyte in the sample read at 700 nm: Absorbance of unknown sample = 0.807 Absorbance of a 130 mg/dl standard = 0.234 Do not answer in image format. Maintain accuracy and quality in your answer. Answer completely.Individually weigh each of the nine nickels used in part 2b. Then calculate the average,average deviation, and standard deviation of the nine samples. The mass of a U. S. nickel,when minted, is 5.000 g. What is the percent error between your average and the U. S. Mintvalue? Pay close attention to your significant figures when doing these calculations. Sample Mass (g) Average Mass ____________ gNo.1 _5.029 ______ Average Deviation ____________ g2 _5.010 ______ Standard Deviation ____________ g3 _4.983 ______ Percent Error ____________ %4 _5.036 ______5 _4.989 ______6 _5.026 ______7 _5.028 ______8 _4.980 ______9 _4.952 ______ im having issues with average deviation and standard deviationAfter creating her standard curve for absorption versus the concentration (M) of FD&C Red 40 and processing her data, Sally found that her drinking strength Kool-Aid sample had a concentration of 4.692 x 10⁻⁵ M. If 0.132 grams of Kool-Aid powder was used to prepare an 8-fl oz cup of her assigned flavor, what is the percent by mass of FD&C Red 40 in her Kool-aid powder? Report your answer as a percentage with two places after the decimal. Do not include the percentage sign in your answer. Pay attention to units. You are trying to find the mass percentage of red dye, so you need to know each variable in the equation in Appendix B. Note that the percent by mass equation should be multiplied by 100. There may be some useful conversion factors in the experimental procedure.
- What are the differences between systematic and random errors and how do they effect accuracy and precision? In what circumstances would you use standard addition (versus a normal calibration curve) to determine the amount of an analyte in a sample? A urine sample, containing analyte Z is analysed by the standard addition method where 5 mL of the original sample was mixed with increasing amounts of a Z standard and each solution diluted to a volume of 50 mL prior to analysis. A plot of the final concentration of the standard in each of the 50 mL samples (x axis) versus The measured signal from the analysis of each 50 mL sample (on y axis) produced a straight line with the general equation: y = 44.72x + 4.06 what was the final concentration of Z in the 50 mL standard addition sample? what was the initial concentration of Z in the original urine sample?A series of standards were analyzed which gave the following results SOLUTION % Transmittance 0 mL of 0.100 mg/mL Hg + 2 mL tinchloride in a total volume of 75 mL 100 1.0 mL of 0.100 mg/mL Hg + 2 mL of tinchloride in a total volume of 75 mL 81.3 2.0 mL of 0.100 mg/mL Hg + 2 mL of tinchloride in a total volume of 75 mL 63.9 3.0 mL of 0.100 mg/mL Hg + 2 mL of tinchloride in a total volume of 75 mL 55 5.0 mL of 0.100 mg/mL Hg + 2 mL of tinchloride in a total volume of 75 mL 35.1 How would you make a Beer-Lambert Plot with this information?The method described above is to be used for the analysis of ores that assay about 1.2% gold. What minimum sample mass should be taken if the relative error resulting from a 0.4-mg loss is not to exceed a. -0.1% b. -0.8%
- A 0.1 g amine-containing compound is dissolved in water then diluted to 100 mL. You subject it to spectroscopic analysis, in order to get the concentration of amine in this compound. Next, you get 1 mL of the previously diluted sample then dilute it again to 250 mL for measurement. Then, you fill 3/4 of a 1-cm cuvette with this diluted sample, and you run an analysis using an AAS. The recorded absorbance is 0.545 at 410 nm. What is the molecular weight of the compound? (The molar absorptivity is 1.23 x 104 cm-1 mol-1 L.)In the Mountain Dew assay, the absorbances recorded for a 10.0 mg/L caffeine solution at 230 nm were 0.2842, 0.2847, 0.2850. The average absorbance and its standard deviation, to the correct number of statistical significant figures, is: Select one: a. 0.2846 (±0.0004) b. 0.2844 (±0.0001) c. 0.2850 (±0.0001) d. 0.2849 (±0.0002) e. 0.2846(±0.0007)Types of Error; Propagation of Uncertainty from Random ErrorYou prepare an NH3 [FM 17.030 5 (±0.000 2)] solution by diluting 7.36 (±0.03) mL of a 28.00 (±0.05) wt% NH3 solution [density = 0.899 (±0.003) g/mL] to a final volume of 500.00 (±0.02) mL. Find the molarity of the NH3 solution along with its absolute uncertainty.
- Approximately 15% of the particles in a shipment of silver-bearing ore are judged to be argentite (d=7.3 g/cm^3, 87% Ag); the remainder are siliceous (d=2.6 g/cm^3) and contain essentially no silver. a. Calculate the number of particles that should be taken for the gross sample if the relative standard deviation due to sampling is to be 2% or less. b. Estimate the mass of the gross sample, assuming that the particles are spherical and have an average diameter of 3.5 mm.The gold content of an ore is being measured. The results of these analyses are: Content (ppt) 20.065 19.999 21.054 20.533 20.088 20.112 What is the average value, standard deviation and confidence interval for this set of data?Show each step of the calculation. Using your results calculate the %accuracy and %precision (relative standard deviation) if the true value is 20.045%.explain the results of this experimet Table 2 Absorbance vs CoCl2 concentration Test Tube Number Cobalt Chloride Concentration (mol/mL) Absorbance at 510 nm 1 0.000 0.000 2 0.009 0.024 3 0.018 0.055 4 0.027 0.085 5 6 0.036 0.045 0.112 0.138 7 (Unknown) 0.088
