
MATLAB: An Introduction with Applications
6th Edition
ISBN: 9781119256830
Author: Amos Gilat
Publisher: John Wiley & Sons Inc
expand_more
expand_more
format_list_bulleted
Related questions
Question
thumb_up100%
Using the data in the image, I need to find the regression using the data analysis in excel. I don’t know which should be the input x or the input y range . Smoking data is to be with each of the remaining four data depicting the types of cancer. Can anyone help?
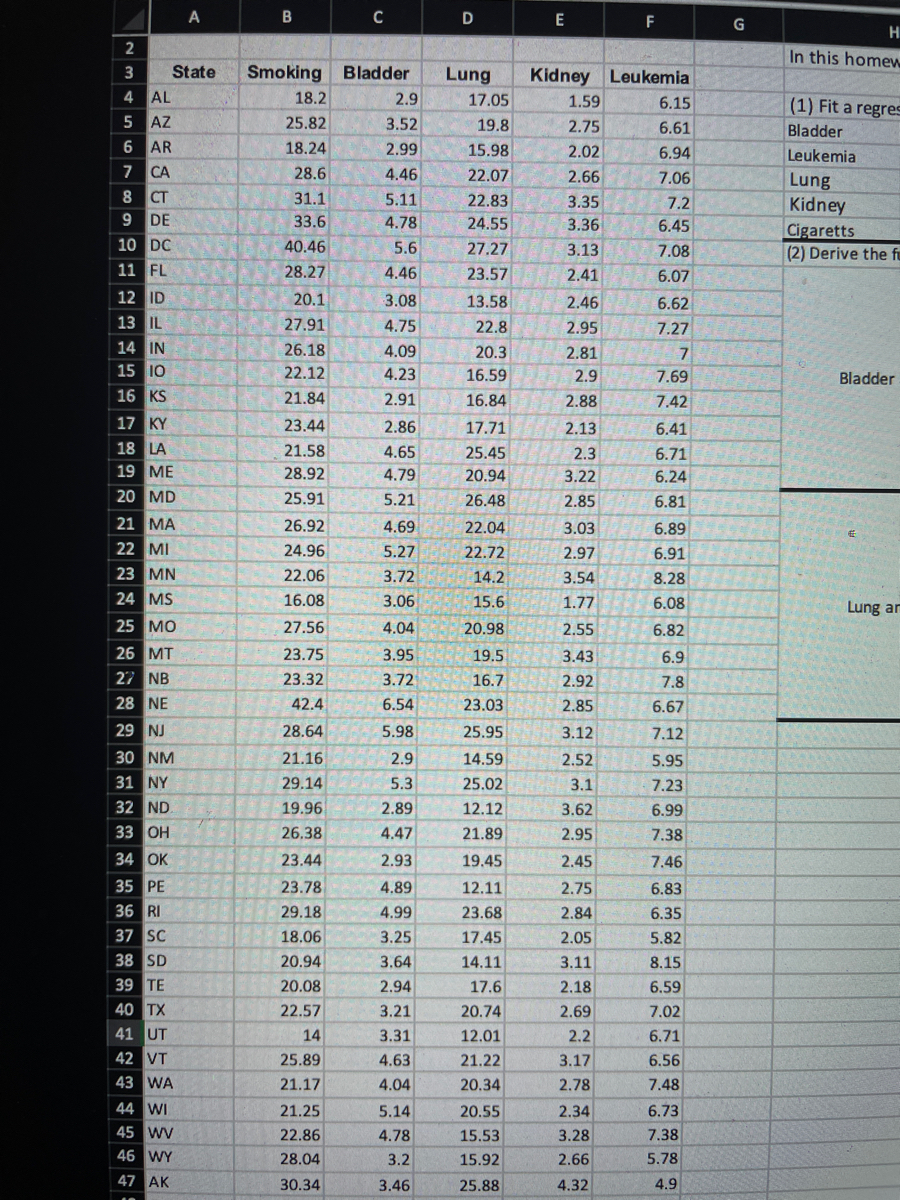

Transcribed Image Text:C
D
E
F
H
2
In this homew
3
State
Smoking Bladder
Lung
Kidney Leukemia
4 AL
18.2
2.9
17.05
1.59
6.15
(1) Fit a regres
5 AZ
6 AR
CA
25.82
3.52
19.8
2.75
6.61
Bladder
18.24
2.99
15.98
2.02
6.94
Leukemia
7
28.6
4.46
22.07
2.66
7.06
Lung
Kidney
8
CT
31.1
5.11
22.83
3.35
7.2
DE
33.6
4.78
24.55
3.36
6.45
10 DC
11 FL
Cigaretts
(2) Derive the fu
40.46
5.6
27.27
3.13
7.08
28.27
4.46
23.57
2.41
6.07
12 ID
20.1
3.08
13.58
2.46
6.62
13 IL
14 IN
15 10
27.91
4.75
22.8
2.95
7.27
26.18
4.09
20.3
2.81
22.12
4.23
16.59
2.9
7.69
Bladder
16 KS
21.84
2.91
16.84
2.88
7.42
17 KY
18 LA
19 ME
20 MD
23.44
2.86
17.71
2.13
6.41
21.58
4.65
25.45
2.3
6.71
28.92
4.79
20.94
3.22
6.24
25.91
5.21
26.48
2.85
6.81
21 MA
22 MI
23 MN
26.92
4.69
22.04
3.03
6.89
24.96
5.27
22.72
2.97
6.91
22.06
3.72
14.2
3.54
8.28
24 MS
16.08
3.06
15.6
1.77
6.08
Lung an
25 MO
27.56
4.04
20.98
2.55
6.82
26 MT
23.75
3.95
19.5
3.43
6.9
27 NB
23.32
3.72
16.7
2.92
7.8
28 NE
42.4
6.54
23.03
2.85
6.67
29 NJ
28.64
5.98
25.95
3.12
7.12
30 NM
21.16
2.9
14.59
2.52
5.95
31 NY
32 ND.
29.14
5.3
25.02
3.1
7.23
19.96
2.89
12.12
3.62
6.99
33 OH
26.38
4.47
21.89
2.95
7.38
34 OK
23.44
2.93
19.45
2.45
7.46
35 PE
36 RI
23.78
4.89
12.11
2.75
6.83
29.18
4.99
23.68
2.84
6.35
37 SC
38 SD
39 TE
18.06
3.25
17.45
2.05
5.82
20.94
3.64
14.11
3.11
8.15
20.08
2.94
17.6
2.18
6.59
40 TX
22.57
3.21
20.74
2.69
7.02
41 UT
14
3.31
12.01
2.2
6.71
42 VT
25.89
4.63
21.22
3.17
6.56
43 WA
21.17
4.04
20.34
2.78
7.48
44 WI
45 wv
21.25
5.14
20.55
2.34
6.73
22.86
4.78
15.53
3.28
7.38
46 WY
28.04
3.2
15.92
2.66
5.78
47 AK
30.34
3.46
25.88
4.32
4.9
Expert Solution
This question has been solved!
Explore an expertly crafted, step-by-step solution for a thorough understanding of key concepts.

Step by stepSolved in 2 steps with 6 images

Knowledge Booster

Similar questions
- Please answer parts d, e and f.arrow_forwardRefer to the data set:(-1, 2), (1, 3), (1, 5), (2, 7), (3, 8), (4, 11)Part a: Make a scatter plot and determine which type of model best fits the data.Part b: Find the regression equation.Part c: Use the equation from Part b to determine y when x = 10arrow_forwardThe file Galton on D2L contains the 928 observations Francis Galton used in 1885 to estimate the relationship between the heights of parents and the heights of their children. The column Children refers to the height (in inches) of a child, and the column Mid-Parents refers to the average height (in inches) of the mother and father of that child. You can download this file into Excel and Minitab. a. Calculate the regression Height of Children = a +b (Height of Mid-Parents). b. Calculate the average for Height of Children, and calculate the average Height of Mid-Parents. c. Create a new variable in Minitab which is the Height of Children measured in terms of deviations from its mean. Call this new variable y. Also, create a new variable in Minitab with is the Height of Mid-Parents measured in terms of deviations from its mean. Call this new variable x. Calculate the regression y = a + bx. You can create the new y and x variables in Excel of Minitab, whichever you find more convenient.…arrow_forward
- Show your work please.arrow_forwardI’m taking a statistics and probability class. Please get this correct because I want to learn. I have gotten wrong answers on here beforearrow_forwardAn admissions counselor is looking to determine an equation that relates the graduate grade point averages of students who are newly admitted to an academic program with their undergraduate GPA, their GRE scores, and the number of years they have been out of college. What is the correct format for a multiple regression equation? Select the correct answer below: yˆ=b0+b1x1+b2x2+b3x3 yˆ=b1x1+b2x2+b3x3 yˆ=b0+b1x1+b2x2+b3x3+b4x4 yˆ=b0+b1x1+b2x2arrow_forward
- The arm span and foot length were both measured (in centimeters) for each of 20 students in a biology class. The computer output displays the regression analysis. Which of the following is the best interpretation of the coefficient of determination r2? About 37% of the variation in arm span is accounted for by the linear relationship formed with the foot length. About 65% of the variation in foot length is accounted for by the linear relationship formed with the arm span. About 63% of the variation in arm span is accounted for by the linear relationship formed with the foot length. About 63% of the variation in foot length is accounted for by the linear relationship formed with the arm span.arrow_forwardBelow is the actual data on the speed a person walks or runs in miles/hour and the calories the person burns per lap. Find the linear equation of best fit for this data. Compare the model to the data. Does the model seem to fit the data? Explain. What is the significance of the y-intercept? What is the slope and what does it mean? What is the x-intercept and what does it mean? What is the correlation coefficient and what does it mean? Speed (mph) Calories/lap 1 42 2 31 3 27 4 41 5 40 6 40 7 39 8 38 r answers to the nearest hundredth. The y-intercept means that if a person runs at ----------mph they will burn__________ per lap. The slope means that for each mph you increase your speed, you will burn an additional------------calories pay laparrow_forwardRange of ankle motion is a contributing factor to falls among the elderly. Suppose a team of researchers is studying how compression hosiery, typical shoes, and medical shoes affect range of ankle motion. In particular, note the variables Barefoot and Footwear2. Barefoot represents a subject's range of ankle motion (in degrees) while barefoot, and Footwear2 represents their range of ankle motion (in degrees) while wearing medical shoes. Use this data and your preferred software to calculate the equation of the least-squares linear regression line to predict a subject's range of ankle motion while wearing medical shoes, ?̂ , based on their range of ankle motion while barefoot, ? . Round your coefficients to two decimal places of precision. ?̂ = A physical therapist determines that her patient Jan has a range of ankle motion of 7.26°7.26° while barefoot. Predict Jan's range of ankle motion while wearing medical shoes, ?̂ . Round your answer to two decimal places. ?̂ = Suppose Jan's…arrow_forward
arrow_back_ios
arrow_forward_ios
Recommended textbooks for you
- MATLAB: An Introduction with ApplicationsStatisticsISBN:9781119256830Author:Amos GilatPublisher:John Wiley & Sons Inc
 Probability and Statistics for Engineering and th...StatisticsISBN:9781305251809Author:Jay L. DevorePublisher:Cengage Learning
 Statistics for The Behavioral Sciences (MindTap C...StatisticsISBN:9781305504912Author:Frederick J Gravetter, Larry B. WallnauPublisher:Cengage Learning
  Elementary Statistics: Picturing the World (7th E...StatisticsISBN:9780134683416Author:Ron Larson, Betsy FarberPublisher:PEARSON
 The Basic Practice of StatisticsStatisticsISBN:9781319042578Author:David S. Moore, William I. Notz, Michael A. FlignerPublisher:W. H. Freeman
 Introduction to the Practice of StatisticsStatisticsISBN:9781319013387Author:David S. Moore, George P. McCabe, Bruce A. CraigPublisher:W. H. Freeman
MATLAB: An Introduction with Applications
Statistics
ISBN:9781119256830
Author:Amos Gilat
Publisher:John Wiley & Sons Inc
Probability and Statistics for Engineering and th...
Statistics
ISBN:9781305251809
Author:Jay L. Devore
Publisher:Cengage Learning
Statistics for The Behavioral Sciences (MindTap C...
Statistics
ISBN:9781305504912
Author:Frederick J Gravetter, Larry B. Wallnau
Publisher:Cengage Learning
Elementary Statistics: Picturing the World (7th E...
Statistics
ISBN:9780134683416
Author:Ron Larson, Betsy Farber
Publisher:PEARSON
The Basic Practice of Statistics
Statistics
ISBN:9781319042578
Author:David S. Moore, William I. Notz, Michael A. Fligner
Publisher:W. H. Freeman
Introduction to the Practice of Statistics
Statistics
ISBN:9781319013387
Author:David S. Moore, George P. McCabe, Bruce A. Craig
Publisher:W. H. Freeman