
MATLAB: An Introduction with Applications
6th Edition
ISBN: 9781119256830
Author: Amos Gilat
Publisher: John Wiley & Sons Inc
expand_more
expand_more
format_list_bulleted
Related questions
Concept explainers
Topic Video
Question
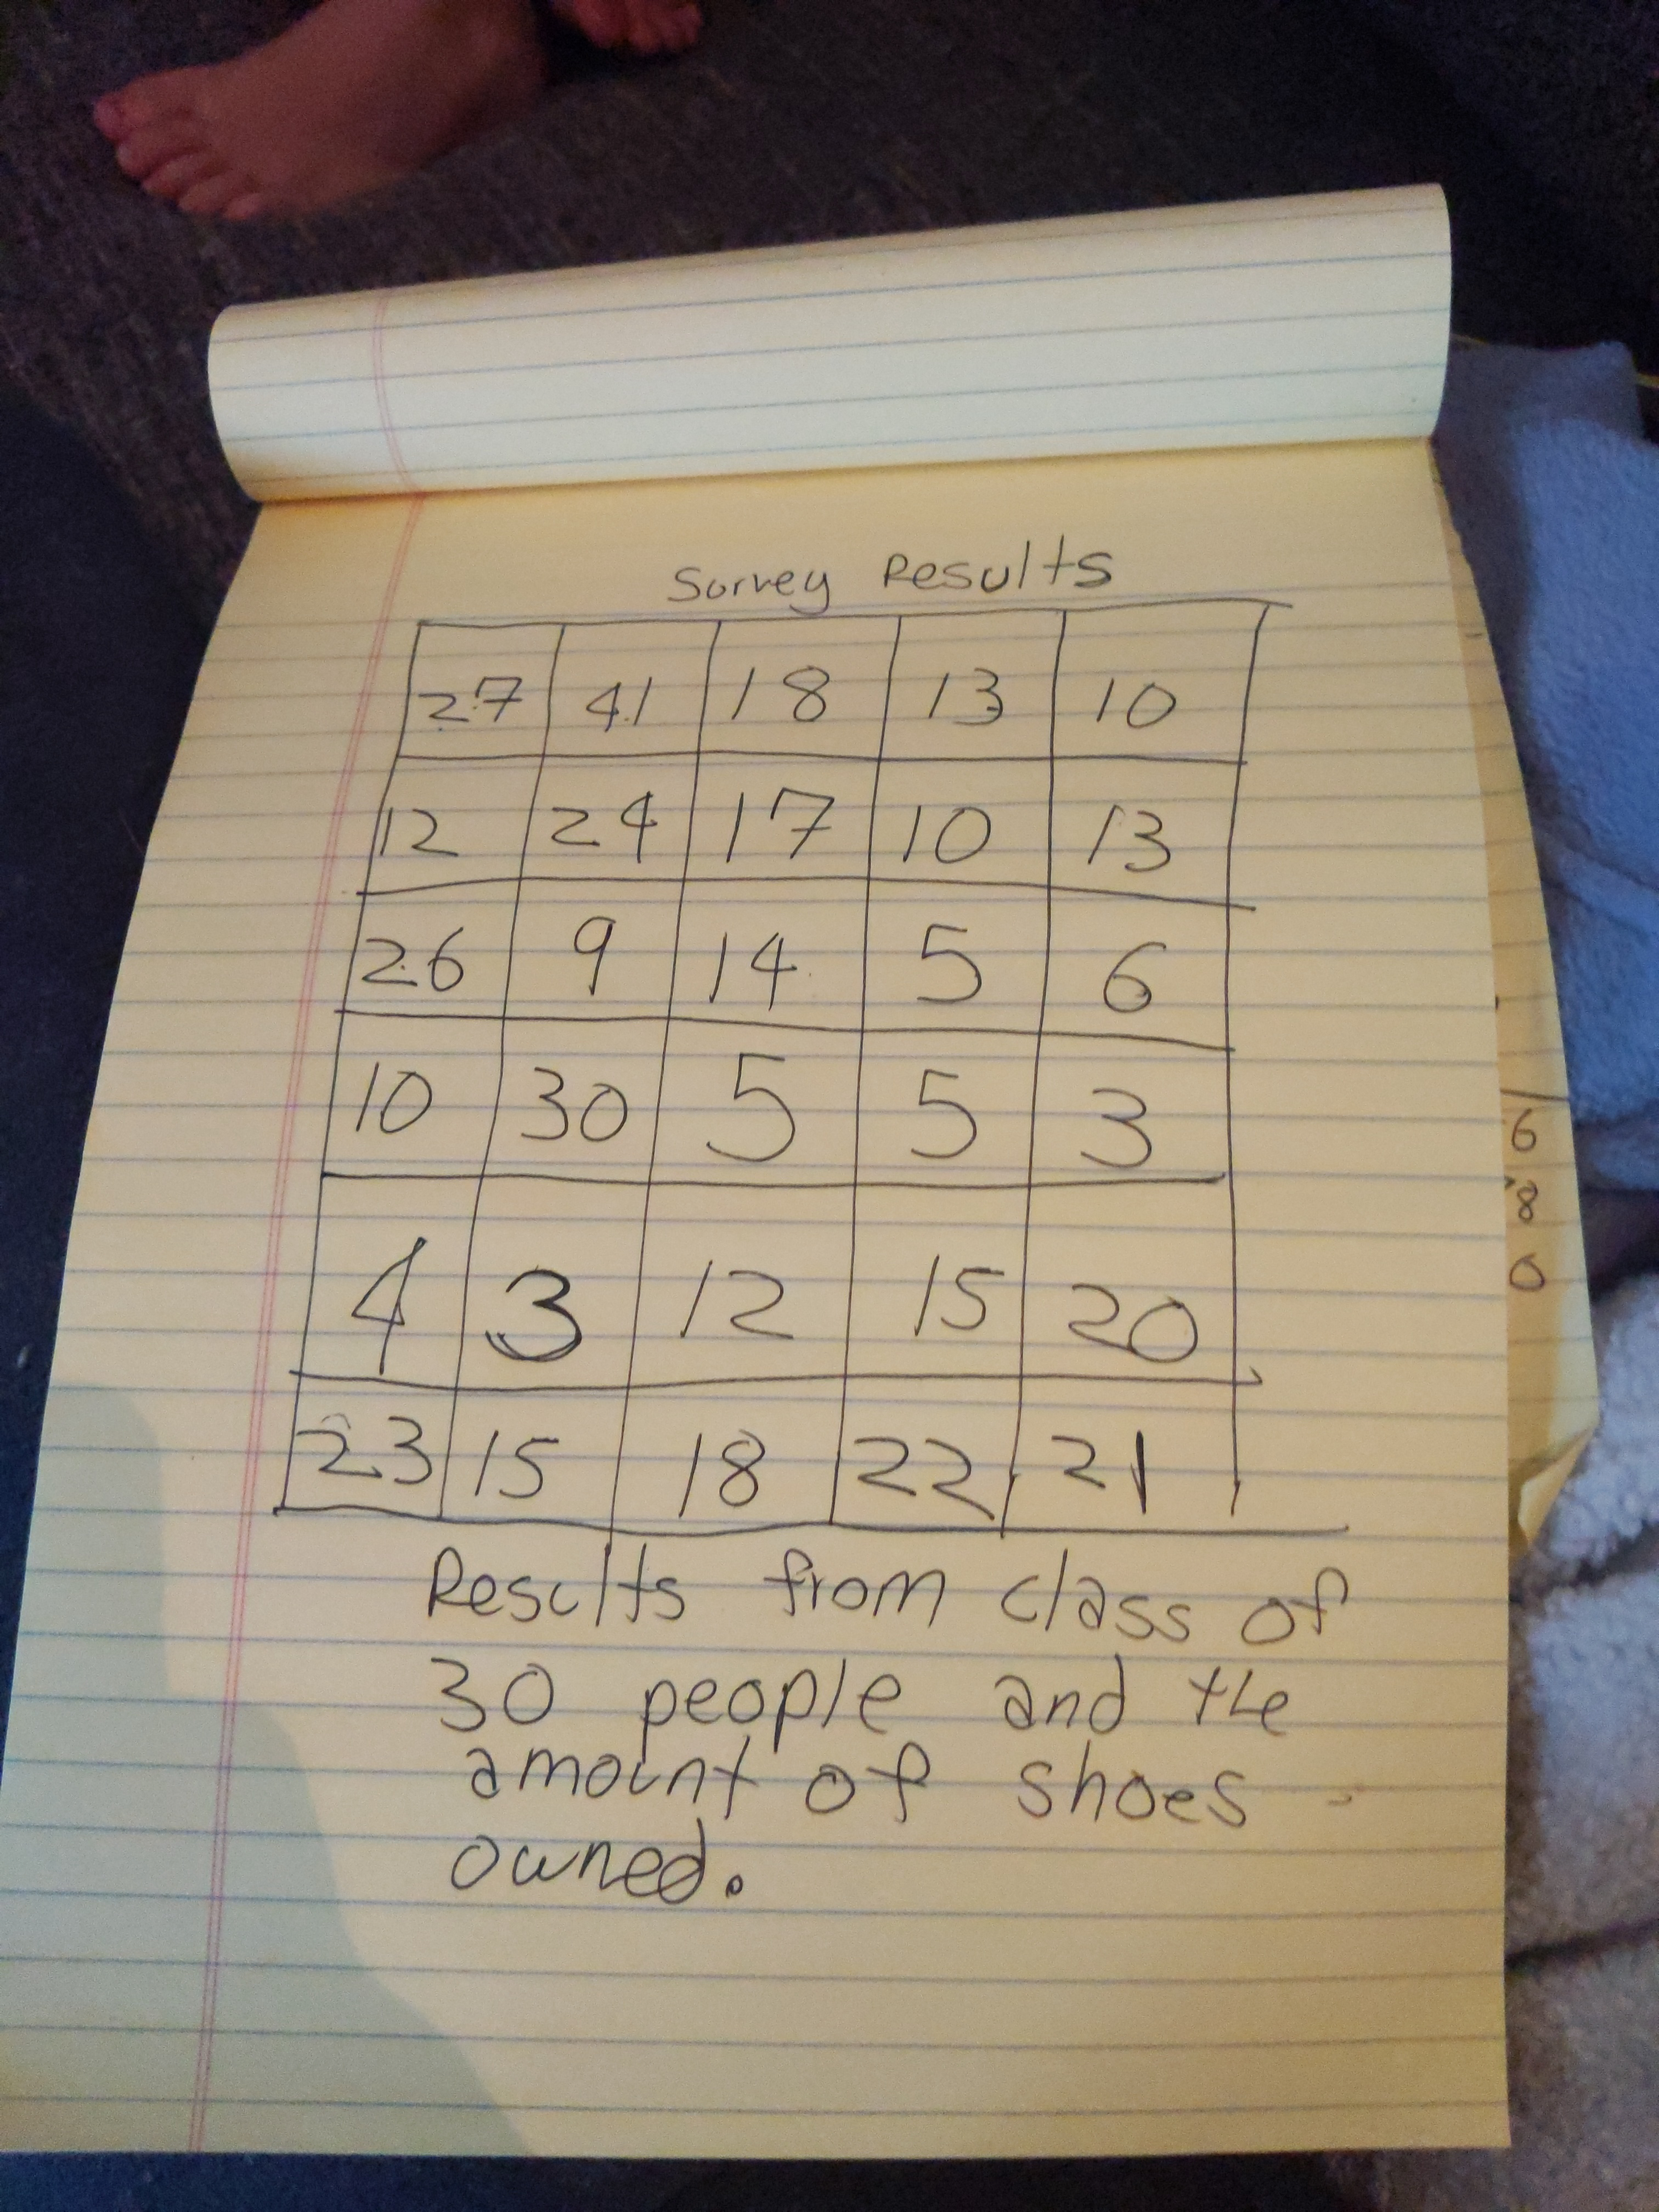
Using the data table provided: construct a box plot of data. Use an accurate and consistent scale.
A)what does the shape of the box plot imply about the concentration of data? Explain using complete sentences
B) what does IQR represent in this problem? Use the context of the example to provide meaning to your statement.
C) using the box plot and the IQR, explain the procedure for determining if there are potential outliers, and show it.

Expert Solution
This question has been solved!
Explore an expertly crafted, step-by-step solution for a thorough understanding of key concepts.

Step by stepSolved in 2 steps with 1 images

Knowledge Booster


Learn more about
Need a deep-dive on the concept behind this application? Look no further. Learn more about this topic, statistics and related others by exploring similar questions and additional content below.Similar questions
- The tuition and fees (in thousands of dollars) for the top 14 universities in a recent year are listed below. Find the mean, median, and mode of the data, if possible. If any of these measures cannot be found or a measure does not represent the center of the data, explain why. 46 44 44 44 46 47 41 46 ㅁ 44 35 41 44 46 39arrow_forward2arrow_forwardUse a stem-and-leaf plot that has two rows for each stem to display the data, which represent the income (in millions) of 30 of the highest paid athletes. Describe any patterns. EM 37 36 44 50 35 58 56 67 48 63 46 37 77 45 34 44 43 81 53 38 73 34 38 87 34 53 41 42 45 58 Determine the leaves in the stem-and-leaf plot below. Key: 3|3= 33 Income (S millions) 4 . 8. 8. Enter your answer in the edit fields and then click Check Answer. Check Answer 1 part remaining Clear All 3.arrow_forward
- Make a box-and-whisker plot. Label the minimum, maximum, first quartile, median, and third quartile. Daily Attendance: 29, 24, 28, 32, 30, 31, 26, 33 Show Your Workarrow_forwardpls help mearrow_forwardThe boxes below contain 14 numbers, listed in order, of which 6 have been removed. Your job is to use the clues given to determine the missing numbers. Write your answers in the boxes. Mean is 26 The median is 22 The interquartile range is 20 The mode is 18 The range is 60 1 4 15 18 29 30 32 58 Second assignment 1) Use Technology (Desmos Calculator) to create a dot plot that represents the distribution of the data. Then describe the shape of the distribution. (look at past notes about shapes) 6 14 11 8 13 10 10 12 12 10 7 11 9 11 9 11 9 8 2) Find the mean and the median of the data. 3) Find the mean and median of the data with 2 additional values included as described. a) add 2 values to the original data set that are greater than 14. b) add 2 values to the original data set that are less than 6. c) Ass 1 value that is greater than 14 and 1 value that is less than 6 to the original data set. d) Add the two values, 50 and 100. To the…arrow_forward
- A pediatrician wants to determine the relation that may exist between a child's height and head circumference. She randomly selects 5 children and measures their height and head circumference. The data are summarized below. Complete parts (a) through (f) below. Height (inches), x Head Circumference (inches), y 27.75 27.5 25.5 26 270 17.6 17.5 17.1 17.3 17.5 (a) Treating height as the explanatory variable, x, use technology to determine the estimates of B and B4 Po z bo = (Round to four decimal places as needed.) B, xb, = (Round to four decimal places as needed.)arrow_forwardDetermine whether the following statement is true or false. If it is false, rewrite it as a true statement. The mean is the measure of central tendency most likely to be affected by an outlier. Choose the correct answer below. OA. The statement is true. OB. The statement is false. The median is the measure outlier. f central tendency most likely t OC. The statement is false. The mode is the measure OD. The statement is false. Outliers do not affect any measure of central tendency. affected by an central tendency most likely to be affected by an outlier.arrow_forward1, If there is a non-linear relationship between a predictor variable and an outcome, what kind of shape would the scatterplot resemble? explain detail. along with the scatter plot. 2.. Why would the scatterplot resemble a funnel/triangle if the assumption of homoscedasticity is violated? explain with figures.arrow_forward
- Determine whether the following statement is true or false. If it is false, rewrite it as a true statement. The mean is the measure of central tendency most likely to be affected by an outlier. Choose the correct answer below. OA. The statement is false. Outliers do not affect any measure of central tendency. B. The statement is false. The mode is the measure of central tendency most likely to be affected by an outlier. OC. The statement is false. The median is the measure of central tendency most likely to be affected by an outlier. OD. The statement is true.arrow_forwardUse a stem-and-leaf plot to display the data, which represent the numbers of hours 24 nurses work per week. Describe any patterns. 40 40 44 48 35 40 36 58 32 36 40 35 D 30 28 36 40 36 40 33 40 32 38 29 Determine the leaves in the stem-and-leaf plot below. Key: 3|3 = 33 Hours worked 2 4 What best describes the data? O A. Most nurses work under 40 hours per week. O B. Most nurses work over 40 hours per week. O C. Most nurses work between 40 and 50 hours per week, inclusive. O D. Most nurses work between 30 and 40 hours per week, inclusive. 40 3.arrow_forwardStudents in a chemistry class took a test. The following are the scores they earned. Fill in the stem-and-leaf plot below use the tens place as the stem and the ones place as the leaf. Describe the shape of the distribution. a) Data were collected for variable(s). Is it appropriate to make a stem-and-leaf plot for this type of data and number of variables? . b) Complete the stem-and-leaf plot below. You must put commas between the leaves. c) What shape is the stem-and-leaf plot above?arrow_forward
arrow_back_ios
SEE MORE QUESTIONS
arrow_forward_ios
Recommended textbooks for you
- MATLAB: An Introduction with ApplicationsStatisticsISBN:9781119256830Author:Amos GilatPublisher:John Wiley & Sons Inc
 Probability and Statistics for Engineering and th...StatisticsISBN:9781305251809Author:Jay L. DevorePublisher:Cengage Learning
 Statistics for The Behavioral Sciences (MindTap C...StatisticsISBN:9781305504912Author:Frederick J Gravetter, Larry B. WallnauPublisher:Cengage Learning
  Elementary Statistics: Picturing the World (7th E...StatisticsISBN:9780134683416Author:Ron Larson, Betsy FarberPublisher:PEARSON
 The Basic Practice of StatisticsStatisticsISBN:9781319042578Author:David S. Moore, William I. Notz, Michael A. FlignerPublisher:W. H. Freeman
 Introduction to the Practice of StatisticsStatisticsISBN:9781319013387Author:David S. Moore, George P. McCabe, Bruce A. CraigPublisher:W. H. Freeman
MATLAB: An Introduction with Applications
Statistics
ISBN:9781119256830
Author:Amos Gilat
Publisher:John Wiley & Sons Inc
Probability and Statistics for Engineering and th...
Statistics
ISBN:9781305251809
Author:Jay L. Devore
Publisher:Cengage Learning
Statistics for The Behavioral Sciences (MindTap C...
Statistics
ISBN:9781305504912
Author:Frederick J Gravetter, Larry B. Wallnau
Publisher:Cengage Learning
Elementary Statistics: Picturing the World (7th E...
Statistics
ISBN:9780134683416
Author:Ron Larson, Betsy Farber
Publisher:PEARSON
The Basic Practice of Statistics
Statistics
ISBN:9781319042578
Author:David S. Moore, William I. Notz, Michael A. Fligner
Publisher:W. H. Freeman
Introduction to the Practice of Statistics
Statistics
ISBN:9781319013387
Author:David S. Moore, George P. McCabe, Bruce A. Craig
Publisher:W. H. Freeman