
MATLAB: An Introduction with Applications
6th Edition
ISBN: 9781119256830
Author: Amos Gilat
Publisher: John Wiley & Sons Inc
expand_more
expand_more
format_list_bulleted
Related questions
Question
Identify the lower class limits, upper class limits, class width, class midpoints, and class boundaries for the given frequency distribution. Also identify the number of individuals included in the summary.
a. Identify the lower class limits (in 1000cells/muL).
(Type integers or decimals. Do not round. Use ascending order.)
b. Identify the upper class limits (in 1000 cells/muL).
(Type integers or decimals. Do not round. Use ascending order.)
c. Identify the class width (in 1000 cells/muL).
(Type an integer or a decimal. Do not round.)
d. Identify the class midpoints (in 1000cells/muL).
(Type integers or decimals. Do not round. Use ascending order.)
e. Identify the class boundaries (in 1000cells/muL).
(Type integers or decimals. Do not round. Use ascending order.)
f. Identify the number of individuals included in the summary.
(Type an integer or a decimal. Do not round.)
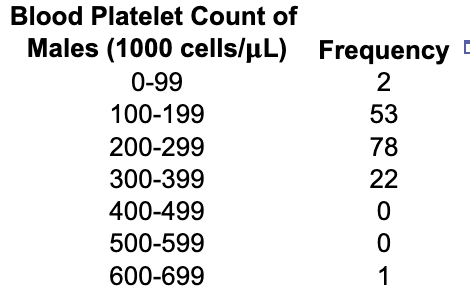

Transcribed Image Text:Blood Platelet Count of
Males (1000 cells/µL) Frequency E
0-99
2
100-199
53
200-299
78
300-399
22
400-499
500-599
600-699
1
Expert Solution
This question has been solved!
Explore an expertly crafted, step-by-step solution for a thorough understanding of key concepts.

Step by stepSolved in 2 steps

Knowledge Booster

Similar questions
- Below are the times (in days) it takes for a sample of 16 customers from Jack's computer store to pay their invoices. 19, 15, 43, 39, 35, 31, 27, 22, 34, 34, 34, 30, 30, 26, 26, 26 Send data to calculator Draw the frequency polygon for these data using an initial class boundary of 14.5 and a class width of 7. Note that you can add or remove classes from the figure. Label each class with its midpoint. Frequency 6- Time (in days) Check Save For Later Submit Ass O 2021 McGraw Hill LLC. All Rights Reserved Terms of Use Privacy Center MacBook ►► 4) SC FS F7 FB F9 F11 F2 F4 + % & 2$ 4. @ 23 2 3 7 8 9 Q W E R T Y U A S F G H. K > V В alt alt MOSISO command option ntrol option command .. .· V CUarrow_forwardFourteen different second-year medical students at a hospital measured the blood pressure of the same person. The systolic readings (mm Hg) are listed below. Use the given data to construct a boxplot and identify the 5-number summary. 145 150 135 120 120 125 127 130 149 150 137 140 134 150 The 5-number summary is, I. (Use ascending order. Type integers or decimals. Do not round.) and all in mm Hg. Which boxplot below represents the data? O A. OB. 130 140 150 더 120 140 150 면 120 130 Blood Pressure (mm Hg) Blood Pressure (mm Hg) OC. OD. 130 140 120 140 Blood Pressure (mm Hg) 120 150 E 130 150 C Blood Pressure (mm Hg)arrow_forwardOn the right are raw test scores from a history test. a. Construct an ordered stem and leaf plot for the given data. b. Construct a grouped frequency table for these scores with intervals of 5, starting the first class at 55. c. Draw a histogram of the data. d. If a circle graph of the grouped data in (b) were drawn, how many degrees would be in the section representing the 55–59 interval? 55 61 72 80 94 61 71 79 72 74 77 79 88 83 89 86 88 81 86 82 80 97 92 94 94arrow_forward
- Subm Terms of Use I Privacy Cente 2. Household Televisions O 2021 McGraw Hill LLC. All Rights Resenved. 5. 1. 2 0. 1. 1. 2. 2. 0. Household Televisions 2 4. 2 6. 2 4. 0. 14. 96 Thirty households were surveyed for the number of telewisions in each home. Following are the results. Construct a frequency histogram. Continue Scoolarrow_forwardFinish times (to the nearest hour) for 59 dogsled teams are shown below. Draw a relative-frequency histogram. Use five classes. 261 274 236 244 280 296 284 296 288 288 250 256 338 360 341 333 261 267 287 296 313 311 307 307 299 303 277 283 304 305 286 290 286 287 297 299 332 330 309 326 307 326 285 291 295 298 306 315 310 318 318 320 333 321 323 324 327 302 319 The frequency table for the above data is given below. Class Limits Boundaries Midpoint Freq. Relative Freq. Cumulative Freq. 236 – 260 235.5 – 260.5 248 4 0.07 4 261 – 285 260.5 – 285.5 273 9 0.15 13 286 – 310 285.5 – 310.5 298 26 0.44 39 311 – 335 310.5 – 335.5 323 17 0.29 56 336 – 360 335.5 – 360.5 348 3 0.05 59arrow_forwardBelow is the frequency distribution of personal Computers on by students at a community college. Find the percent represented by sony computers brand Frequency dell 3,200 sony 5,200 hp 4,400 toshiba 6,600 asus. 3,600arrow_forward
- 1. 1, 2, 2, 3, 3, 4, 5, 6, 7, 7, 8, 8, 8, 9, 10, 11, 11, 13, 15, 15, 21,24, 28, 32 a. Construct a frequency table. b. Construct a histogram (use 5 as the number of classes and starting point at 1).arrow_forwardThis data was collected from the members of our class. I have tried to remove anything that would identify an individual. 1. What is the scale of each variable? 2. Construct a frequency table and chart showing the distribution across gender in this class. 3. Construct a cross tabulation with Gender in one direction and Height in the other direction. Group the height category into 5 groups. 4. Is there a difference in the age distribution across gender? 5. Give a summary of our class based on this data about our class. Gender Height Year Born Male 76 1994 Male 72 1983 Female 65 1997 Male 68 1966 Female 67 1997 Male 70 1996 Male 71 1996 Male 73 1996 Male 72 1995 Male 71 1998 Male 73 1993 Female 66 1980 Female 62 1998 Male 76 1984 Female 70 1985 Female 62 1992 Female 62 1992 Male 73 1996 Female 68 1987 Male 60 1971 Female 60 1971 Male 60 1971 Male 74 1970 Male 77 1998 Male 77 1998 Male 68 1990 Female 64 1996 Male 80 1997 Male…arrow_forwardSelect the correct answer and write the appropriate letter in the space provided _____ 1. A grouping of data into classes giving the number of observations in each class is called a(an) a bar chart. b. frequency distribution. c. pie chart. d. cumulative frequency distribution. ______ 2. The distance between consecutive lower class limits is called the a. class interval. b. frequency distribution. c. class midpoint. d. class frequency. ______ 3. The class midpoint is a. equal to the number of observations. b. found by adding the lower class limits of two consecutive classes and dividing by 2. c. equal to the class interval. d. all of the above. ______ 4. The number of observations in a particular class is called the a. class interval. b. class frequency. c. frequency distribution. d. none of the above. ______ 5. A bar chart is used most often when a. you want to show frequencies as compared to total observations. b. you want to show…arrow_forward
- Below are the times (in days) it takes for a sample of 22 customers from Jack's computer store to pay their invoices. 19, 15, 43, 39, 35, 31, 27, 22, 18, 14, 42, 38, 13, 13, 41, 41, 37, 37, 37, 33, 33, 33 Send data to calculator Draw the frequency polygon for these data using an initial class boundary of 12.5 and a class width of 7. Note that you can add or remove classes from the figure. Label each class with its midpoint. Frequency 7. Check 26°F Clear Q Search 0:00 00:0 X Save For Later C Submit Assignmearrow_forwardFourteen different second-year medical students at a hospital measured the blood pressure of the same person. The systolic readings (mm Hg) are listed below. Use the given data to construct a boxplot and identify the 5-number summary. 135 120 131 125 O A. 138 O C. The 5-number summary is ☐☐☐☐, and all in mm Hg. (Use ascending order. Type integers or decimals. Do not round.) Which boxplot below represents the data? 120 120 130 129 Blood 140 sure (mm Hg) 130 140 Blood Pressure (mm Hg) 150 150 Q Q 125 Q 130 ... OB. O D. 150 120 120 143 126 140 130 Blood Pressure (mm Hg) 130 140 Blood Pressure (mm Hg) 140 150 150 126 150 D₂₁arrow_forward17. fill in whole chartarrow_forward
arrow_back_ios
arrow_forward_ios
Recommended textbooks for you
- MATLAB: An Introduction with ApplicationsStatisticsISBN:9781119256830Author:Amos GilatPublisher:John Wiley & Sons Inc
 Probability and Statistics for Engineering and th...StatisticsISBN:9781305251809Author:Jay L. DevorePublisher:Cengage Learning
 Statistics for The Behavioral Sciences (MindTap C...StatisticsISBN:9781305504912Author:Frederick J Gravetter, Larry B. WallnauPublisher:Cengage Learning
  Elementary Statistics: Picturing the World (7th E...StatisticsISBN:9780134683416Author:Ron Larson, Betsy FarberPublisher:PEARSON
 The Basic Practice of StatisticsStatisticsISBN:9781319042578Author:David S. Moore, William I. Notz, Michael A. FlignerPublisher:W. H. Freeman
 Introduction to the Practice of StatisticsStatisticsISBN:9781319013387Author:David S. Moore, George P. McCabe, Bruce A. CraigPublisher:W. H. Freeman
MATLAB: An Introduction with Applications
Statistics
ISBN:9781119256830
Author:Amos Gilat
Publisher:John Wiley & Sons Inc
Probability and Statistics for Engineering and th...
Statistics
ISBN:9781305251809
Author:Jay L. Devore
Publisher:Cengage Learning
Statistics for The Behavioral Sciences (MindTap C...
Statistics
ISBN:9781305504912
Author:Frederick J Gravetter, Larry B. Wallnau
Publisher:Cengage Learning
Elementary Statistics: Picturing the World (7th E...
Statistics
ISBN:9780134683416
Author:Ron Larson, Betsy Farber
Publisher:PEARSON
The Basic Practice of Statistics
Statistics
ISBN:9781319042578
Author:David S. Moore, William I. Notz, Michael A. Fligner
Publisher:W. H. Freeman
Introduction to the Practice of Statistics
Statistics
ISBN:9781319013387
Author:David S. Moore, George P. McCabe, Bruce A. Craig
Publisher:W. H. Freeman