What are the correct hypotheses? (Select the correct symbols and use decimal values not percentages.) Ho: | Select an answer || ? +J| Select an answer H1:| Select an answer || ? +| Select an answer + Original Claim = Select an answer df = Based on the hypotheses, find the following: Test Statistic = (Round to three decimal places.) Critical value(s) = (Round to three decimal places.) Shade the sampling distribution curve with the correct critical value(s) and shade the critical regions. The arrows can only be dragged to t-scores that are accurate to 1 place after the decimal point (these values correspond to the tick marks on the horizontal axis). Select from the drop down menu to shade to the left, to the right, between or left and right of the t-score(s). Shade: Left of a value +). Click and drag the arrows to adjust the values. -4 -1 4 -1.5 Decision: Select an answer Conclusion: Select an answer + the claim that the mpg on desert roads is better than in the mountains.
What are the correct hypotheses? (Select the correct symbols and use decimal values not percentages.) Ho: | Select an answer || ? +J| Select an answer H1:| Select an answer || ? +| Select an answer + Original Claim = Select an answer df = Based on the hypotheses, find the following: Test Statistic = (Round to three decimal places.) Critical value(s) = (Round to three decimal places.) Shade the sampling distribution curve with the correct critical value(s) and shade the critical regions. The arrows can only be dragged to t-scores that are accurate to 1 place after the decimal point (these values correspond to the tick marks on the horizontal axis). Select from the drop down menu to shade to the left, to the right, between or left and right of the t-score(s). Shade: Left of a value +). Click and drag the arrows to adjust the values. -4 -1 4 -1.5 Decision: Select an answer Conclusion: Select an answer + the claim that the mpg on desert roads is better than in the mountains.

College Algebra (MindTap Course List)
12th Edition
ISBN:9781305652231
Author:R. David Gustafson, Jeff Hughes
Publisher:R. David Gustafson, Jeff Hughes
Chapter8: Sequences, Series, And Probability
Section8.7: Probability
Problem 58E: What is meant by the sample space of an experiment?

Related questions
Topic Video
Question
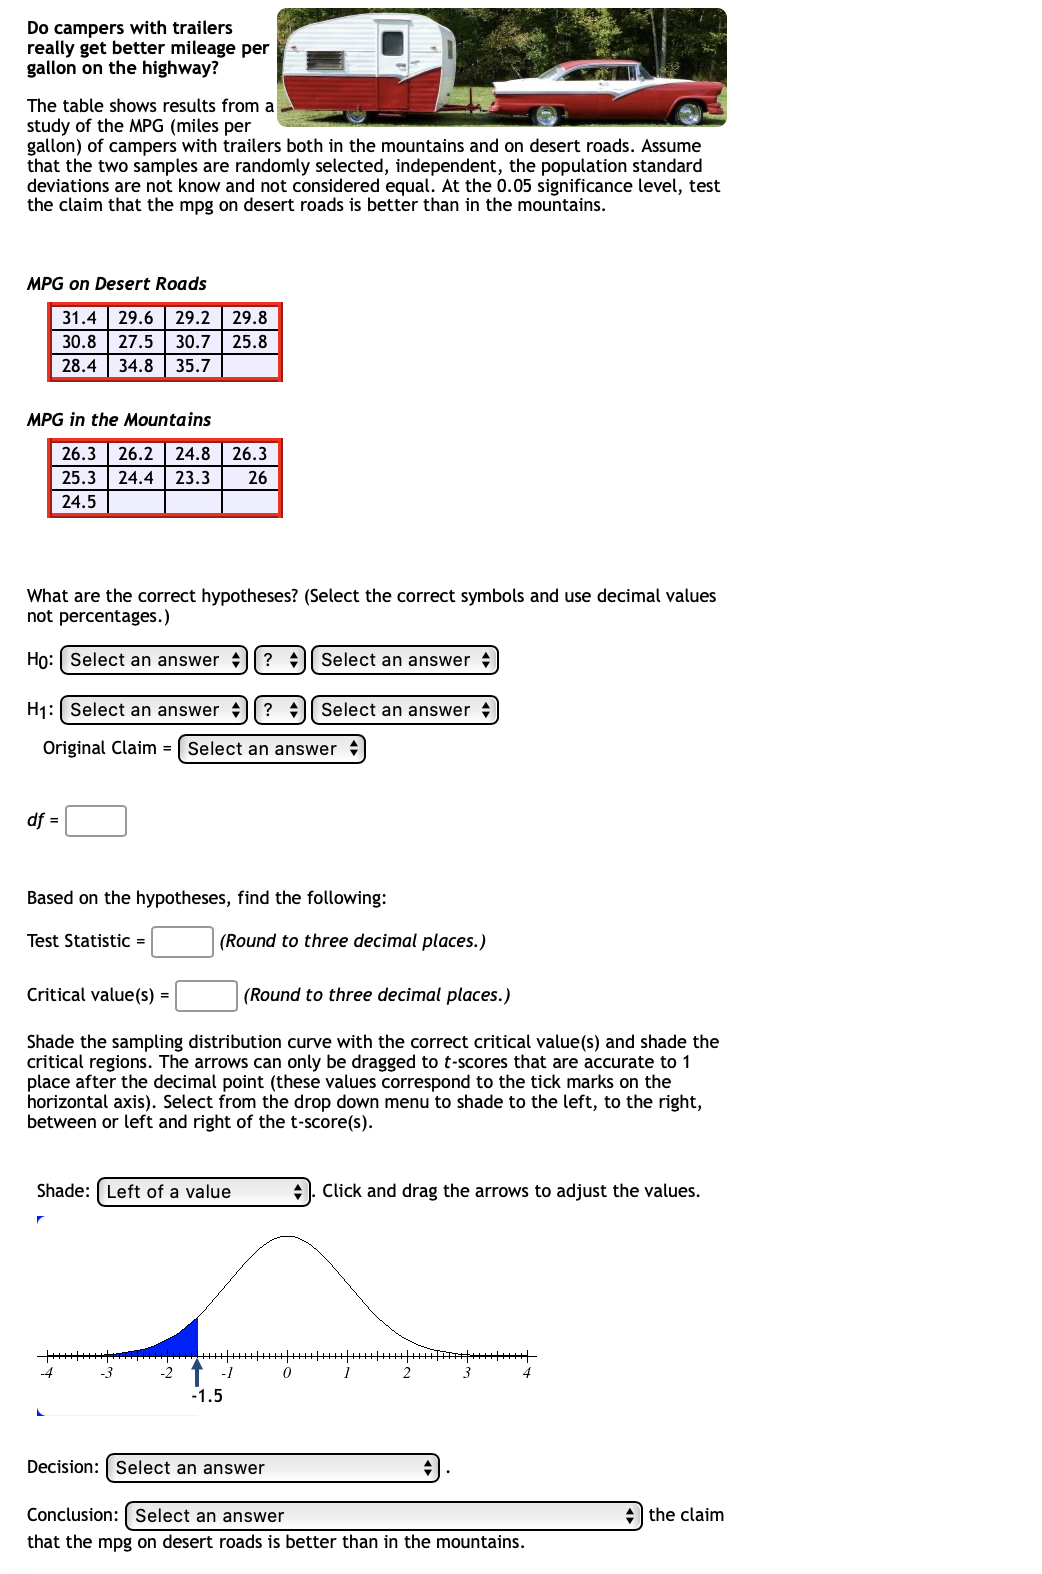
Transcribed Image Text:Do campers with trailers
really get better mileage per
gallon on the highway?
The table shows results from a
study of the MPG (miles per
gallon) of campers with trailers both in the mountains and on desert roads. Assume
that the two samples are randomly selected, independent, the population standard
deviations are not know and not considered equal. At the 0.05 significance level, test
the claim that the mpg on desert roads is better than in the mountains.
MPG on Desert Roads
29.2 | 29.8
30.7 | 25.8
31.4
29.6
30.8 27.5
28.4
34.8
35.7
MPG in the Mountains
26.3 | 26.2
25.3 | 24.4
24.8 26.3
23.3
26
24.5
What are the correct hypotheses? (Select the correct symbols and use decimal values
not percentages.)
Ho:| Select an answer || ? +|| Select an answer
H1: Select an answer
? : Select an answer
Original Claim = [ Select an answer +
df =
Based on the hypotheses, find the following:
Test Statistic =
(Round to three decimal places.)
Critical value(s) =
(Round to three decimal places.)
Shade the sampling distribution curve with the correct critical value(s) and shade the
critical regions. The arrows can only be dragged to t-scores that are accurate to 1
place after the decimal point (these values correspond to the tick marks on the
horizontal axis). Select from the drop down menu to shade to the left, to the right,
between or left and right of the t-score(s).
Shade: [ Left of a value
Click and drag the arrows to adjust the values.
-1
4
-1.5
Decision: Select an answer
Conclusion: Select an answer
the claim
that the mpg on desert roads is better than in the mountains.
Expert Solution
This question has been solved!
Explore an expertly crafted, step-by-step solution for a thorough understanding of key concepts.

Step by step
Solved in 3 steps with 3 images

Knowledge Booster


Learn more about
Need a deep-dive on the concept behind this application? Look no further. Learn more about this topic, statistics and related others by exploring similar questions and additional content below.Recommended textbooks for you
College Algebra (MindTap Course List)
Algebra
ISBN:
9781305652231
Author:
R. David Gustafson, Jeff Hughes
Publisher:
Cengage Learning
College Algebra (MindTap Course List)
Algebra
ISBN:
9781305652231
Author:
R. David Gustafson, Jeff Hughes
Publisher:
Cengage Learning