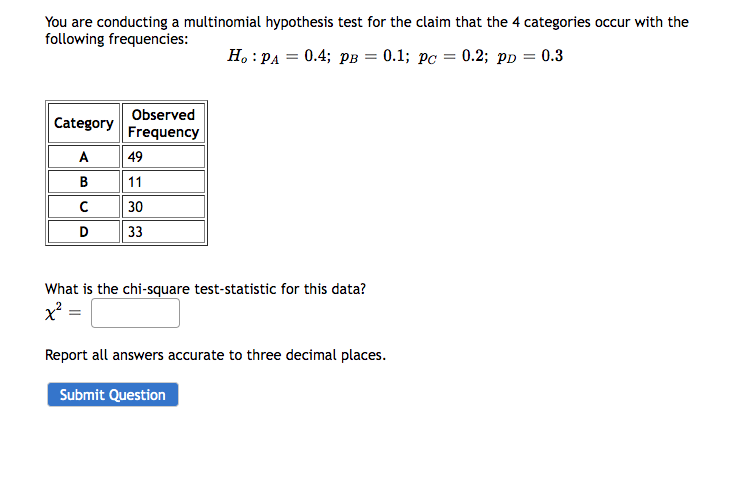
You are conducting a multinomial hypothesis test for the claim that the 4 categories occur with the following frequencies: Category A B C D Observed Frequency 49 11 30 33 = Ho: PA = 0.4; PB = 0.1; PC What is the chi-square test-statistic for this data? 0.2; PD = 0.3


Q: What is the z-score of x = 9, if it is 0.133 standard deviations to the left of the mean?
A: Given X=9,
Q: Find the mean, median, and mode for the following data set. Round your answers to one decimal place,…
A: Given 11,24,24,-13,14
Q: ence interval for a population mean, compute the margin of error, E. 11.00<μ<13.1411.00<μ<13.14
A: Given the confidence interval 11.00<μ<13.14 Computing the Margin of error is given as below:
Q: b) Let Zi σχ dy i) State, with parameter(s), the probability distribution of the statistic, T = ii)…
A: As per bartleby guidelines we can solve only first three subparts and rest can be reposted
Q: In randomized, double-blind clinical trials of a new vaccine, toddlers were randomly divided into…
A: The question is about hypo. testing for difference between two popl. prop. Given : Total no. of…
Q: 3. In the linear regression model Y₁ Bo+B₁X₁+Ei, an alternate estimator Y Â₁=X. State all the CLRM…
A: x explanatory variable y Dependent variable The equation of the linear model is y = β0+β1xi+εi…
Q: Answer this following questions relate to an outbreak of diarrheal disease among nursing home…
A: Given the table containing characteristics of residents of Nursing home A during an outbreak of…
Q: Which of the following is a double-barreled question? Do you like the new school uniform? Do you…
A: A double barreled question is difficult to answer. It is like you are asked two questions but it…
Q: The following sample of 8 grade point averages and marks in matriculation was observed for students…
A:
Q: Nails are sold in a packet of 100. Occasionally a nail is faulty. The number of faulty nails in a…
A: It is interpreted that, each nail has the only options of being "faulty" (i.e., denoted as success)…
Q: Suppose a ball is thrown upward at time t = 0 with initial height X and initial upward velocity Y,…
A:
Q: Problem 4 In a poker game, Melanie has a very strong hand and bets $5. The probability that Ben has…
A: The probability of Ben has better hand is 0.04 Ben has a better hand he would raise with probability…
Q: Fit the following two curves to these data: linear (Y 5 a 1 bX) and power (Y 5 aXb). Which equation…
A:
Q: In order to see whether mood affects reaction times in a cognitive task, researchers have a group of…
A: Given Total grp of participants =6 Each perform task 3 times Therefore N=6×3=18
Q: ht bulb manufacturer wants to compare the mean lifetimes of two of its light bulbs, model A and…
A: Given that Sample sizes n1=11 , n2=13 Sample means X̄1=1323 , X̄2=1366 s1 =95…
Q: QUESTION 23 "Calculate the SS-Total for an independent measures ANOVA with 15 observations in each…
A:
Q: b) Let Z₁ = X-x~N (0,1), and Wi σχ YHY~N(0,1), for i=1,2,3,...,10, then: ay i) State, with…
A: Given Zi~N(0,1) and Wi~N(0,1) Result: t~F(a,b) Then Mean=E(t)=b/(b-2) V(t)=2b2 (a+b-2)/[a(b-2)2…
Q: 1. Consider the population consisting of the values (1, 3, 8). a. List all the possible samples of…
A: Since you have posted a question with multiple sub-parts, we will solve first three subparts for…
Q: When seven basketball players are about to have a free-throw competition, they often draw names out…
A: Given that: Number of basketball players, n=7 Required probability: All 7 of them will shoot in an…
Q: 1,000 800 600 400 200 0 Sales of Sony Blu-Ray Disc Players at Bob's Appliance Mart (a) What kind of…
A: The given graph is a column chart with pictures for columns. Here, the size of the CD gives an…
Q: Bob Nale is the owner of Nale's Quick Fill. Bob would like to estimate the mean number of gallons of…
A: Population is the whole set of observation used for the study. Sample is the any subset of…
Q: Using the latest in medical technology, an orthopedic doctor has developed a new surgical procedure…
A: There are two independent samples which are new procedure and standard procedure. We have to test…
Q: Assume that the error term u is normally distributed with a mean of 0 and a standard deviation of…
A: The term standard deviation is denoted by the symbol sigma (σ). It is given that u is normally…
Q: Question 26 letter d-i
A: d) The objective is to find coefficient of determination r2: From part (a), the correlation…
Q: show that a RW model without drift is non stationary when doing times series
A: Given the statement that a random walk (RW) without drift is non stationary.
Q: Use the data in the following table, which lists drive-thru order accuracy at popular fast food…
A:
Q: ΟΥ σχ i) Find the mean and variance of the statistic T = 10 Σtwi2 Σ112,2 10 i=1
A:
Q: QUESTION 11 The Pearson s product moment correlation coefficient (r) is derived by calculating the…
A: Given that The Pearson's product moment correlation coefficient ( r ) is derived by
Q: Appointments
A:
Q: QUESTION 13 What do you do, if the p-value in your hypothesis test is equal to 0.0002? O The…
A: Given that P-value = 0.0002
Q: 96 96 126 128 Calculate the interquartile 102 128 102 156 range and sample variance in this…
A: Since the data is already in increasing order so no need to arrange it…
Q: Let X₁, X2, X3,..., X30 be a random sample of size 30 from a population distributed with the…
A: The distribution of X is given by, f(x) = 12e-x2, if 0<x<∞0otherwise So, EXr =…
Q: On a planet far far away from Earth, IQ of the ruling species is normally distributed with a mean of…
A: For the distribution of the IQ scores of individuals, it is interpreted that: μ (mean)=107, σ…
Q: (a) Set up the null and alternative hypotheses needed to attempt to establish that the mean annual…
A: Given: n1=12n2=12x¯1=1.49s1=0.33x¯2=0.90s2=0.26
Q: he number of cans of soft drinks sold in a machine each week is recorded below. Develop forecasts…
A: Introduction: We need to forecast using the three-week weighted moving average method, and obtain…
Q: Find the (a) mean, (b) median, (c) mode, and (d) midrange for the data and then (e) answer the given…
A: Note: As per my policy i can answer only three sub parts. kindly repost the remaining sub parts.…
Q: Hello! The question is as follows: Which of the following is the best estimate of the number of…
A: It is interpreted that: The total no. of HRDs invited to complete the survey is 333. 45% of the…
Q: What are the range, variance, and standard deviation of 0, 5, 10, 15, 20, and 25?
A: The following information has been given: 0, 5, 10, 15, 20, 25
Q: A business analyst believes she can use a model to add value to a current problem facing her…
A: The business analyst builds a linear model with the outcome of interest as numeric. Outcome of…
Q: Write 5 characteristics that applies to the normal distribution curve. The monthly salaries of…
A: 5 characteristics that applies to the normal distribution curve in below step
Q: Science teacher interviews all of the students who are members of the school science club. This type…
A: Solution-: We want to find the type of sampling for following example Science teacher interviews all…
Q: The IQ scores of 50 students are given below. 90 98 102 113 85 106 101 94 89 85 94 112 108 111 111…
A: The question is about freq. dist. Given : To find : a ) Construct freq. table b ) Histogram
Q: Question: A response variable has two possible explanatory variables, X₁ and X₂. Three linear models…
A: Akaike Information Criterion is a measure that estimates the amount of information lost by the given…
Q: A light bulb manufacturer advertises that the average life for its light bulbs is 900 hours. a…
A: Since only sample information available, use t distribution test for single mean.
Q: Match each term with its notation. Enter the number corresponding to the correct notation in the…
A: The objective is to match each term with its notation:
Q: question 25 which of the following options is the correct mean square within treatments value for…
A:
Q: The following ten scores were obtained on a 20-point quiz: 4, 5, 8, 9, 11, 13, 15, 18, 18, and 20.…
A: Given: The obtained scores on a 20 point quiz: 4, 5, 8, 9, 11, 13, 15, 18, 18, and 20.
Q: BUG's stock price S is $50 today. It pays a dividend of $0.25 after two months and $0.30 after five…
A:
Q: You are required to find each of the following measures for the set of data The Midrange The…
A: Given that The data set 104, 104, 104, 104, 104, 107, 109, 109, 109, 110, 109, 111, 112, 111, 109
Q: Find the mean, median, and mode for the following data set. Round your answers to one decimal place,…
A: Given data: 11, 24, 24, -13, 14

Step by step
Solved in 2 steps

- Recently, the annual number of driver deaths per 100,000 for the selected age groups was as follows: Age Number of Driver Deaths per 100,000 16–19 38 20–24 36 25–34 24 35–54 20 55–74 18 75+ 28 Use the 4 steps of hypothesis testing to see if the prediction is significant with a criteria of alpha=.05 on the following data For each age group, pick the midpoint of the interval for the X value. (For the 75+ group, use 80.)A sample of 12 radon detectors of a certain type was selected, and each was exposed to 100 pCi/L of radon. The resulting readings were as follows: 105.6 90.9 91.2 96.9 96.5 91.3 100.1 105.5 99.6 107.7 103.3 92.4 Does this data suggest that the population mean reading under these conditions differ from 100? State the null and alternative hypotheses. Calculate, correct to 2 decimal places, the sample mean, x ; and the sample standard deviation, s. Evaluate the appropriate test statistic. Test these hypotheses at 05 level of significance.A sample of 12 radon detectors of a certain type was selected, and each was exposed to 100 pCi/L of radon. The resulting readings were as follows: 104.3 89.6 89.9 95.6 95.2 90.0 98.8 103.7 98.3 106.4 102.0 91.1 a)Does this data suggest that the population mean reading under these conditions differs from 100? State and test the appropriate hypotheses using =.05. b) Suppose that prior to the experiment, a value of teta=7.5 had been assumed. How many determinations would then have been appropriate to obtain beta=.10 for the alternative u=95 ?
- The following data are on the dental measurements (distance in mm from the center of the pituitary to the pterygomaxillary fissure of 11 girls and 16 boys, all of whom were 16 years of age. a) What are the appropriate null and alternative hypotheses for this research question using the appropriate population parameter(s) for SAS output for a t-test? b) Based on the output, which p-value tests the following hypotheses if you want to use a two-sample independent pooled t-test? Provide the specific test statistic and p-value. c) From the output, what is the estimate of the pooled standard deviation? d) From the output, what is the standard error for the average difference in dental measurements in the population of 16-year-old boy and 16-year-old girls (assume the population variances are equal)?An article includes the accompanying data on compression strength (lb) for a sample of 12-oz aluminum cans filled with strawberry drink and another sample filled with cola. Beverage Sample Size Sample Mean Sample SD Strawberry Drink 10 535 24 Cola 10 559 15 Does the data suggest that the extra carbonation of cola results in a higher average compression strength? Base your answer on a P-value. (Use ? = 0.05.) State the relevant hypotheses. (Use ?1 for the strawberry drink and ?2 for the cola.) H0: ?1 − ?2 = 0Ha: ?1 − ?2 ≥ 0H0: ?1 − ?2 = 0Ha: ?1 − ?2 ≠ 0 H0: ?1 − ?2 = 0Ha: ?1 − ?2 < 0H0: ?1 − ?2 = 0Ha: ?1 − ?2 > 0 Calculate the test statistic and determine the P-value. (Round your test statistic to one decimal place and your P-value to three decimal places.) t = P-value = State the conclusion in the problem context. Reject H0. The data suggests that cola has a higher average compression strength than the strawberry drink.Reject H0. The…The NAEP considers that a national average of 283 is an acceptable performance. Using α = .05, run a two-tail t-test for one sample to test Ho: µ=283 for the 2019 scores. Report the t-obt, df, and p-values. Would you reject the null hypothesis that the 2019 scores come from a population with average 283? If this is the case, does it come from a population from larger or smaller average?
- The effectiveness of a new bug repellent is tested on 1616 subjects for a 10 hour period. (Assume normally distributed population.) Based on the number and location of the bug bites, the percentage of surface area exposed protected from bites was calculated for each of the subjects. The results were as follows: ?⎯⎯⎯=92x¯=92, ?=13 s=13 The new repellent is considered effective if it provides a percent repellency of at least 9090. Using ?=0.05α=0.05, construct a hypothesis test with null hypothesis ?≤90μ≤90 and alternative hypothesis ?>90μ>90 to determine whether the mean repellency of the new bug repellent is greater than 9090 by computing the following: (a) the degree of freedom (b) the test statistic The final conclusion is A. There is not sufficient evidence to reject the null hypothesis that ?≤90μ≤90. Our results do not provide enough evidence that the new bug repellent is effective. B. We can reject the null hypothesis that ?≤90μ≤90. Our results indicate that…You are conducting a multinomial Goodness of Fit hypothesis test for the claim that the 4 categories occur with the following frequencies:HoHo : pA=0.4 pB=0.3 ; pC=0.15 ; pD=0.15Complete the table. Report all answers accurate to three decimal places. Category ObservedFrequency ExpectedFrequency Residual A 44 B 34 C 32 D 19 What is the chi-square test-statistic for this data?χ2=For significance level alpha 0.1, what is the chi-square Critical Value?Critical Value = What would be the conclusion of this hypothesis test? Reject the Null Hypothesis Fail to reject the Null Hypothesis Report all answers accurate to three decimal placesThe following display from a TI-84 Plus calculator presents the results of a hypothesis test for a population mean μ.u<52 t=-4.479421 p=0.000020 x=51.87 Sx=0.21523 n=55Do you reject H0 at the a=0.10 level of significance? Question 5 options: No Yes
- In a hypothesis test with hypotheses H0 :pless than or greater than 0.58 and H1 >0.58 , a random sample of size 1,165 produced a sample proportion of 0.6160. The test is to be made at the 2.5% significance level. What is the value of the test statistic, z, rounded to three decimal places?The average annual miles driven per vehicle in the United States is 11.1 thousand miles, with σ ≈ 600 miles. Suppose that a random sample of 36 vehicles owned by residents of Chicago showed that the average mileage driven last year was 10.9 thousand miles. Does this indicate that the average miles driven per vehicle in Chicago is different from (higher or lower than) the national average? Use a 0.05 level of significance. State the null and alternate hypotheses. a) H0: p = 11.1; H1: p > 11.1 b) H0: p = 11.1; H1: p < 11.1 c) H0: μ = 11.1; H1: μ > 11.1 d) H0: μ = 11.1; H1: μ ≠ 11.1 e) H0: p = 11.1; H1: p ≠ 11.1 f) H0: μ = 11.1; H1: μ < 11.1 (b) What sampling distribution will you use? What assumptions are you making? a) The standard normal, since we assume that x has a normal distribution with known σ. b) The Student's t, since we assume that x has a normal distribution with unknown σ. c) The Student's t, since we assume that x has a normal distribution with known σ.…You are conducting a multinomial hypothesis test for the claim that the 4 categories occur with the following frequencies:HoHo : pA=0.3; pB=0.1; pC=0.4; pD=0.2 Category ObservedFrequency A 26 B 13 C 34 D 13 What is the chi-square test-statistic for this data?χ2=Report all answers accurate to three decimal places.


