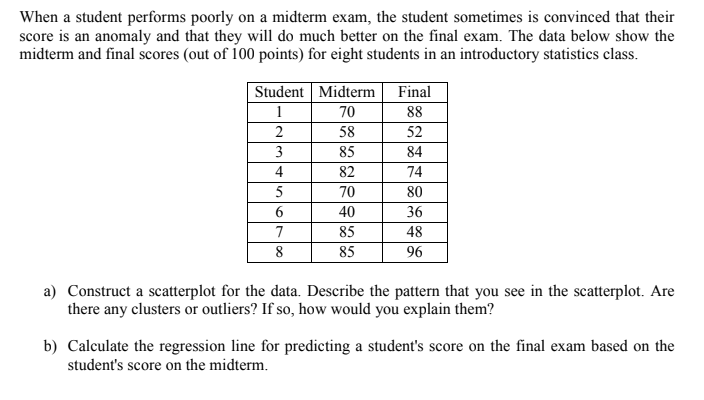
When a student performs poorly on a midterm exam, the student sometimes is convinced that their score is an anomaly and that they will do much better on the final exam. The data below show the midterm and final scores (out of 100 points) for eight students in an introductory statistics class. Student Midterm Final 1 70 88 52 84 2 58 3 85 4 82 74 5 70 80 40 36 7 85 48 8 85 96 a) Construct a scatterplot for the data. Describe the pattern that you see in the scatterplot. Are there any clusters or outliers? If so, how would you explain them? b) Calculate the regression line for predicting a student's score on the final exam based on the student's score on the midterm.
When a student performs poorly on a midterm exam, the student sometimes is convinced that their score is an anomaly and that they will do much better on the final exam. The data below show the midterm and final scores (out of 100 points) for eight students in an introductory statistics class. Student Midterm Final 1 70 88 52 84 2 58 3 85 4 82 74 5 70 80 40 36 7 85 48 8 85 96 a) Construct a scatterplot for the data. Describe the pattern that you see in the scatterplot. Are there any clusters or outliers? If so, how would you explain them? b) Calculate the regression line for predicting a student's score on the final exam based on the student's score on the midterm.

Glencoe Algebra 1, Student Edition, 9780079039897, 0079039898, 2018
18th Edition
ISBN:9780079039897
Author:Carter
Publisher:Carter
Chapter10: Statistics
Section10.4: Distributions Of Data
Problem 19PFA

Related questions
Question
Transcribed Image Text:When a student performs poorly on a midterm exam, the student sometimes is convinced that their
score is an anomaly and that they will do much better on the final exam. The data below show the
midterm and final scores (out of 100 points) for eight students in an introductory statistics class.
Student Midterm
Final
1
70
88
2
58
52
3
85
84
4
82
74
5
70
80
40
36
7
85
48
8
85
96
a) Construct a scatterplot for the data. Describe the pattern that you see in the scatterplot. Are
there any clusters or outliers? If so, how would you explain them?
b) Calculate the regression line for predicting a student's score on the final exam based on the
student's score on the midterm.
Expert Solution
This question has been solved!
Explore an expertly crafted, step-by-step solution for a thorough understanding of key concepts.

This is a popular solution!

Trending now
This is a popular solution!

Step by step
Solved in 2 steps with 4 images

Recommended textbooks for you
Glencoe Algebra 1, Student Edition, 9780079039897…
Algebra
ISBN:
9780079039897
Author:
Carter
Publisher:
McGraw Hill

College Algebra (MindTap Course List)
Algebra
ISBN:
9781305652231
Author:
R. David Gustafson, Jeff Hughes
Publisher:
Cengage Learning
Glencoe Algebra 1, Student Edition, 9780079039897…
Algebra
ISBN:
9780079039897
Author:
Carter
Publisher:
McGraw Hill
College Algebra (MindTap Course List)
Algebra
ISBN:
9781305652231
Author:
R. David Gustafson, Jeff Hughes
Publisher:
Cengage Learning