
MATLAB: An Introduction with Applications
6th Edition
ISBN: 9781119256830
Author: Amos Gilat
Publisher: John Wiley & Sons Inc
expand_more
expand_more
format_list_bulleted
Related questions
Concept explainers
Question
When dealing with a set of numbers such as these attached, do you always group together for a raw score + z score to then answer for
The main question is: what is the corresponding x score for each raw score?
From there, I need to determine the probability of a raw score greater than 4; less than 2; between 4 & 6; between 3 & 6 but my text only talks about grouping together (like for how I would calculate the mean and SD).
Do I base my probability off the set or is there a more specific way to go about it?
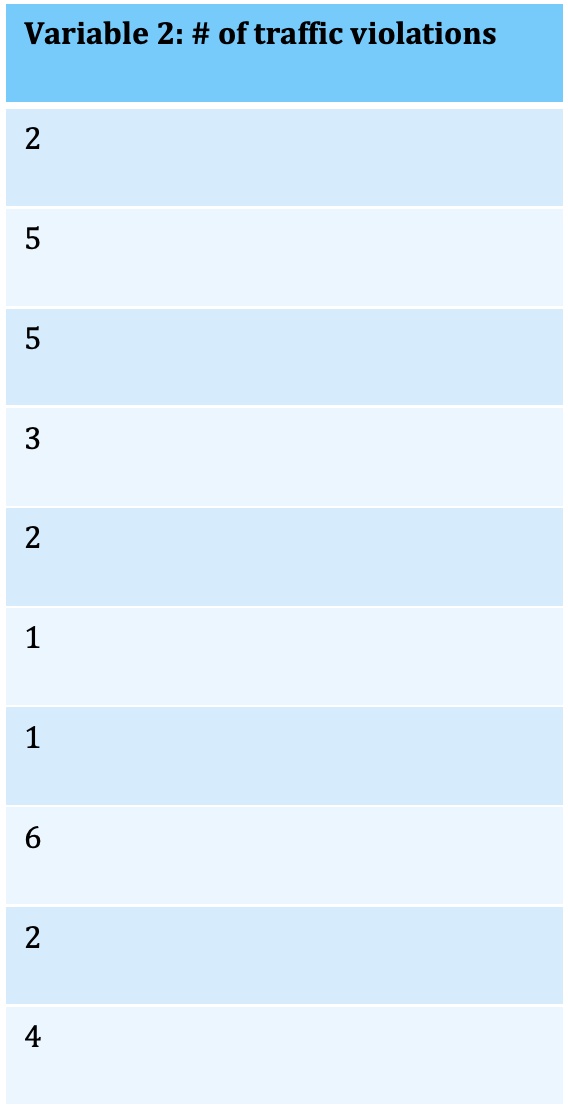

Transcribed Image Text:Variable 2: # of traffic violations
2
5
3
2
1
1
2
4
Expert Solution
This question has been solved!
Explore an expertly crafted, step-by-step solution for a thorough understanding of key concepts.

This is a popular solution

Trending nowThis is a popular solution!

Step by stepSolved in 4 steps

Knowledge Booster


Learn more about
Need a deep-dive on the concept behind this application? Look no further. Learn more about this topic, statistics and related others by exploring similar questions and additional content below.Similar questions
- Please see picture. Need this asap please and thank you.arrow_forwardwhy is it important for students to know something about statistics as applied to psychology?arrow_forwardTo investigate whether one-pound bags of potato chips actually contain a full pound of chips, a skeptical statistics student goes to the supermarket and weighs every bag on the shelf. To analyze these data, what statistical test should i use?arrow_forward
- A psychologist wanted to know if students in her class were more likely to cheat if they were low achievers. She divided her 60 students into three groups (low, middle, and high) based on their mean exam score on the previous three tests. She then asked them to rate how likely they were to cheat on an exam if the opportunity presented itself with a very limited chance for consequences. The students rated their desire to cheat on a scale ranging from 1-100, with lower numbers indicating less desire to cheat. Before opening the data, what would you hypothesize about this research question? Open the data set. Before running any statistical analyses, glance through the data. Do you think that your hypothesis will be supported? Conduct descriptive analyses and report them here. Conduct a one-way ANOVA. Report your statistical findings (including any applicable tables in APA format) here. What would you conclude from this analysis? What would be your next steps, if this…arrow_forwardIf Ted scores in the first quartile on his math test, that means he scored better than most students on the test. True or Falsearrow_forwardA researcher conducts a study comparing anxiety levels in teens based on their social media usage. Teens with higher scores on the anxiety measure are considered more anxious. Below is a table made from their results. Briefly interpret the results by explaining both descriptive and inferential statistics identified.arrow_forward
- Your statistics instructor claims that 60 percent of the students who take her Elementary Statistics class go through life feeling more enriched. For some reason that she can't quite figure out, most people don't believe her. You decide to check this out on your own. You randomly survey 55 of her past Elementary Statistics students and find that 29 feel more enriched as a result of her class. Now, what do you think?arrow_forwardA researcher gathered a sample of participants who volunteered for a studying of phobias. She measured anxiety level of participants as they viewed photos of spiders and again when they viewed puppies. Which statistical test is appropriate for this study and why?arrow_forwardOne personality test available on the World Wide Web has a subsection designed to assess the "honesty" of the test-taker. After taking the test and seeing your score for this subsection, you're interested in the mean score, μ , among the general population on this subsection. The website reports that μ is 148 , but you believe that μ is greater than 148 . You decide to do a statistical test. You choose a random sample of people and have them take the personality test. You find that their mean score on the subsection is 152 and that the standard deviation of their scores is 28 . Based on this information, answer the questions below. What are the null hypothesis ( H0 ) and the alternative hypothesis ( H1 ) that should be used for the test? H0 : μ is H1 : μ is In the context of this test, what is a Type I error?A Type I error is the hypothesis that μ is when, in fact, μ is .Suppose that you decide not to…arrow_forward
- Please also explain why you determined whether or not the results are statistically significant. In another memory experiment, the mean scores for participants in Condition A and Condition B came out exactly the same!arrow_forwardOne personality test available on the World Wide Web has a subsection designed to assess the "honesty" of the test-taker. After taking the test and seeing your score for this subsection, you're interested in the mean score, µ, among the general population on this subsection. The website reports that µ is 142, but you believe that u is less than 142. You decide to do a statistical test. You choose a random sample of people and have them take the personality test. You find that their mean score on the subsection is 135 and that the standard deviation of their scores is 28. Based on this information, answer the questions below. What are the null hypothesis (H) and the alternative hypothesis (H,) that should be used for the test? Ho: u is ? ? |H,: µ is ? H : ? In the context of this test, what is a Type II error? A Type II error is ? v the hypothesis that u is ? v when, in fact, μ is| ? ? Suppose that you decide not to reject the null hypothesis. What sort of error might you be making? ?arrow_forwardOne personality test available on the World Wide Web has a subsection designed to assess the "honesty" of the test-taker. After taking the test and seeing your score for this subsection, you're interested in the mean score, µ, among the general population on this subsection. The website reports that u is 148, but you believe that u is greater than 148. You decide to do a statistical test. You choose a random sample of people and have them take the personality test. You find that their mean score on the subsection is 155 and that the standard deviation of their scores is 28. Based on this information, answer the questions below. What are the null hypothesis (H,) and the alternative hypothesis (H,) that should be used for the test? H: u is ? |H;: µ is ? ? In the context of this test, what is a Type I error? A Type I error is ? fact, u is ? v the hypothesis that u is ? v? v. when, in Suppose that you decide to reject the null hypothesis. What sort of error might you be making? ?arrow_forward
arrow_back_ios
SEE MORE QUESTIONS
arrow_forward_ios
Recommended textbooks for you
- MATLAB: An Introduction with ApplicationsStatisticsISBN:9781119256830Author:Amos GilatPublisher:John Wiley & Sons Inc
 Probability and Statistics for Engineering and th...StatisticsISBN:9781305251809Author:Jay L. DevorePublisher:Cengage Learning
 Statistics for The Behavioral Sciences (MindTap C...StatisticsISBN:9781305504912Author:Frederick J Gravetter, Larry B. WallnauPublisher:Cengage Learning
  Elementary Statistics: Picturing the World (7th E...StatisticsISBN:9780134683416Author:Ron Larson, Betsy FarberPublisher:PEARSON
 The Basic Practice of StatisticsStatisticsISBN:9781319042578Author:David S. Moore, William I. Notz, Michael A. FlignerPublisher:W. H. Freeman
 Introduction to the Practice of StatisticsStatisticsISBN:9781319013387Author:David S. Moore, George P. McCabe, Bruce A. CraigPublisher:W. H. Freeman
MATLAB: An Introduction with Applications
Statistics
ISBN:9781119256830
Author:Amos Gilat
Publisher:John Wiley & Sons Inc
Probability and Statistics for Engineering and th...
Statistics
ISBN:9781305251809
Author:Jay L. Devore
Publisher:Cengage Learning
Statistics for The Behavioral Sciences (MindTap C...
Statistics
ISBN:9781305504912
Author:Frederick J Gravetter, Larry B. Wallnau
Publisher:Cengage Learning
Elementary Statistics: Picturing the World (7th E...
Statistics
ISBN:9780134683416
Author:Ron Larson, Betsy Farber
Publisher:PEARSON
The Basic Practice of Statistics
Statistics
ISBN:9781319042578
Author:David S. Moore, William I. Notz, Michael A. Fligner
Publisher:W. H. Freeman
Introduction to the Practice of Statistics
Statistics
ISBN:9781319013387
Author:David S. Moore, George P. McCabe, Bruce A. Craig
Publisher:W. H. Freeman