
MATLAB: An Introduction with Applications
6th Edition
ISBN: 9781119256830
Author: Amos Gilat
Publisher: John Wiley & Sons Inc
expand_more
expand_more
format_list_bulleted
Related questions
Concept explainers
Question
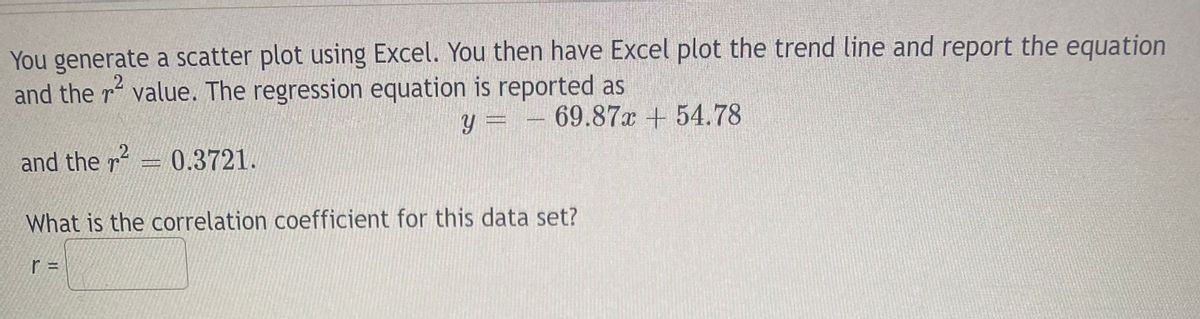

Transcribed Image Text:You generate a scatter plot using Excel. You then have Excel plot the trend line and report the equation
and the r value. The regression equation is reported as
2.
y = – 69.87 + 54.78
and the r 0.3721.
What is the correlation coefficient for this data set?
r =
Expert Solution
This question has been solved!
Explore an expertly crafted, step-by-step solution for a thorough understanding of key concepts.

Step by stepSolved in 2 steps with 1 images

Knowledge Booster


Learn more about
Need a deep-dive on the concept behind this application? Look no further. Learn more about this topic, statistics and related others by exploring similar questions and additional content below.Similar questions
- You generate a scatter plot using Excel. You then have Excel plot the trend line and report the equation and ther value. The regression equation is reported as y = 59.31x + 26.22 and the r2 0.1296. What is the correlation coefficient for this data set? r = Submit Question M -> & 3. 4. 8. CO 6 %24 %23arrow_forwardI need the right answer to this problem.arrow_forwardYou generate a scatter plot using Excel. You then have Excel plot the trend line and report the equation and the r2 value. The regression equation is reported as y = - 61.46x + 41.55 and the r? = 0.16. What is the correlation coefficient for this data set? r =arrow_forward
- Using your favorite statistics software package, you generate a scatter plot with a regression equation and correlation coefficient. The regression equation is reported as -36.51x+76.99 and r = -0.437. What proportion of the variation in y can be explained by the linear regression equation found above? % Report answer as a percentage accurate to one decimal place. Submit Questionarrow_forwardYou generate a scatter plot using Excel. You then have Excel plot the trend line and report the equation and the r2r2 value. The regression equation is reported asy=−38.54x+27.71y=-38.54x+27.71and the r2=0.36r2=0.36.What is the correlation coefficient for this data set?r =arrow_forwardUsing your favorite statistics software package, you generate a scatter plot with a regression equation and correlation coefficient. The regression equation is reported as y = – 17.88x + 41.39 and the r = - 0.405. What proportion of the variation in y can be explained by the variation in the values of x? r2 = Report answer as a percentage accurate to one decimal place.arrow_forward
- Using your favorite statistics software package, you generate a scatter plot with a regression equation and correlation coefficient. The regression equation is reported as y = -10.91x + 44.13 and r = -0.92. What proportion of the variation in y can be explained by the linear regression equation found above? % Report answer as a percentage accurate to one decimal place.arrow_forwardUsing your favorite statistics software package, you generate a scatter plot with a regression equation and correlation coefficient. The regression equation is reported as Y = – 17.88x + 41.39 and the r 0.09. What percentage of the variation in y can be explained by the variation in the values of x? r2 = (Report exact answer, and do not enter the % sign)arrow_forwardThe data show the chest size and weight of several bears. Find the regression equation, letting chest size be the independent (x) variable. Then find the best predicted weight of a bear with a chest size of 58 inches. Is the result close to the actual weight of 572 pounds? Use a significance level of 0.05. Chest size (inches) 46 57 53 41 40 40 Weight (pounds) 384 580 542 358 306 320 LOADING... Click the icon to view the critical values of the Pearson correlation coefficient r. What is the regression equation? y=nothing+nothingx (Round to one decimal place as needed.)arrow_forward
- Using your favorite statistics software package, you generate a scatter plot with a regression equation and correlation coefficient. The regression equation is reported as y = - 74.51a + 28.98 and the r = - 0.339. What proportion of the variation in y can be explained by the variation in the values of x? r2 = Report answer as a percentage accurate to one decimal place.arrow_forwardUsing your favorite statistics software package, you generate a scatter plot with a regression equ correlation coefficient. The regression equation is reported as y = -11.24x +34.27 and the r = -0.47. What proportion of the variation in y can be explained by the variation in the values of x? r² = % Report answer as a percentage accurate to one decimal place. Submit Questionarrow_forwardUsing your favorite statistics software package, you generate a scatter plot with a regression equation and correlation coefficient. The regression equation is reported as 90.18x + 67.52 and the r = -0.345. What proportion of the variation in y can be explained by the variation in the values of x? s2 = Report answer as a percentage accurate to one decimal place.arrow_forward
arrow_back_ios
SEE MORE QUESTIONS
arrow_forward_ios
Recommended textbooks for you
- MATLAB: An Introduction with ApplicationsStatisticsISBN:9781119256830Author:Amos GilatPublisher:John Wiley & Sons Inc
 Probability and Statistics for Engineering and th...StatisticsISBN:9781305251809Author:Jay L. DevorePublisher:Cengage Learning
 Statistics for The Behavioral Sciences (MindTap C...StatisticsISBN:9781305504912Author:Frederick J Gravetter, Larry B. WallnauPublisher:Cengage Learning
  Elementary Statistics: Picturing the World (7th E...StatisticsISBN:9780134683416Author:Ron Larson, Betsy FarberPublisher:PEARSON
 The Basic Practice of StatisticsStatisticsISBN:9781319042578Author:David S. Moore, William I. Notz, Michael A. FlignerPublisher:W. H. Freeman
 Introduction to the Practice of StatisticsStatisticsISBN:9781319013387Author:David S. Moore, George P. McCabe, Bruce A. CraigPublisher:W. H. Freeman
MATLAB: An Introduction with Applications
Statistics
ISBN:9781119256830
Author:Amos Gilat
Publisher:John Wiley & Sons Inc
Probability and Statistics for Engineering and th...
Statistics
ISBN:9781305251809
Author:Jay L. Devore
Publisher:Cengage Learning
Statistics for The Behavioral Sciences (MindTap C...
Statistics
ISBN:9781305504912
Author:Frederick J Gravetter, Larry B. Wallnau
Publisher:Cengage Learning
Elementary Statistics: Picturing the World (7th E...
Statistics
ISBN:9780134683416
Author:Ron Larson, Betsy Farber
Publisher:PEARSON
The Basic Practice of Statistics
Statistics
ISBN:9781319042578
Author:David S. Moore, William I. Notz, Michael A. Fligner
Publisher:W. H. Freeman
Introduction to the Practice of Statistics
Statistics
ISBN:9781319013387
Author:David S. Moore, George P. McCabe, Bruce A. Craig
Publisher:W. H. Freeman