
MATLAB: An Introduction with Applications
6th Edition
ISBN: 9781119256830
Author: Amos Gilat
Publisher: John Wiley & Sons Inc
expand_more
expand_more
format_list_bulleted
Related questions
Question
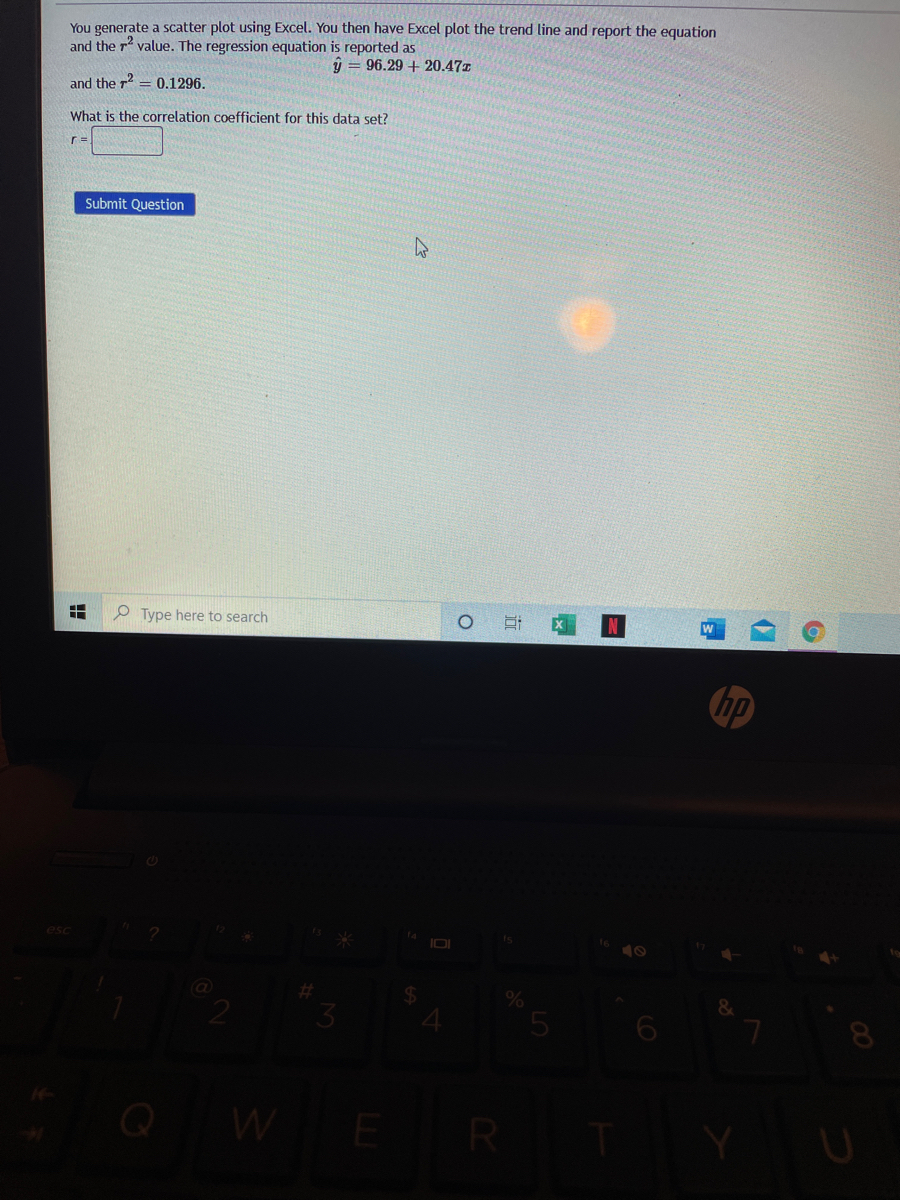

Transcribed Image Text:You generate a scatter plot using Excel. You then have Excel plot the trend line and report the equation
and the r value. The regression equation is reported as
ý = 96.29 + 20.47%
and the r2 = 0.1296.
What is the correlation coefficient for this data set?
r =
Submit Question
Type here to search
hp
is
IDI
%23
0%
Q WE R
Expert Solution
This question has been solved!
Explore an expertly crafted, step-by-step solution for a thorough understanding of key concepts.

This is a popular solution

Trending nowThis is a popular solution!

Step by stepSolved in 2 steps with 1 images

Knowledge Booster

Similar questions
- Using your favorite statistics software package, you generate a scatter plot with a regression equation and correlation coefficient. The regression equation is reported asˆy=−29.73x+47.69 and the r=−0.588What proportion of the variation in y can be explained by the variation in the values of x?Report answer as a percentage accurate to one decimal place.arrow_forwardUsing your favorite statistics software package, you generate a scatter plot with a regression equation and correlation coefficient. The regression equation is reported as y = 98.52x + 27.93 and the r = 0.247. What proportion of the variation in y can be explained by the variation in the values of x? r? = % Report answer as a percentage accurate to one decimal place.arrow_forwardUsing your favorite statistics software package, you generate a scatter plot with a regression equation and correlation coefficient. The regression equation is reported as y=−24.94x+53.67 and the r=−0.78What percentage of the variation in y can be explained by the variation in the values of x?r² = ______% (Report exact answer, and do not enter the % sign)arrow_forward
- You generate a scatter plot using Excel. You then have Excel plot the trend line and report the equation and the r2 value. The regression equation is reported as y = - 61.46x + 41.55 and the r? = 0.16. What is the correlation coefficient for this data set? r =arrow_forwardUsing your favorite statistics software package, you generate a scatter plot with a regression equation and correlation coefficient. The regression equation is reported as -36.51x+76.99 and r = -0.437. What proportion of the variation in y can be explained by the linear regression equation found above? % Report answer as a percentage accurate to one decimal place. Submit Questionarrow_forwardYou generate a scatter plot using Excel. You then have Excel plot the trend line and report the equation and the r2r2 value. The regression equation is reported asy=55.82x+32.43y=55.82x+32.43and the r2=0.3136r2=0.3136.What is the correlation coefficient for this data set?r =arrow_forward
- You generate a scatter plot using Excel. You then have Excel plot the trend line and report the equation and the r value. The regression equation is reported as y = 75.56z + 78.71 and the r = 0.2209. What is the correlation coefficient for this data set?arrow_forwardUsing your favorite statistics software package, you generate a scatter plot with a regression equation and correlation coefficient. The regression equation is reported as y=57.53x+44.95 and the r=0.269 r=0.269.What proportion of the variation in y can be explained by the variation in the values of x?r² = __?__ %Report answer as a percentage accurate to one decimal placearrow_forwardUsing your favorite statistics software package, you generate a scatter plot with a regression equ correlation coefficient. The regression equation is reported as y = -11.24x +34.27 and the r = -0.47. What proportion of the variation in y can be explained by the variation in the values of x? r² = % Report answer as a percentage accurate to one decimal place. Submit Questionarrow_forward
- Using your favorite statistics software package, you generate a scatter plot with a regression equation and correlation coefficient. The regression equation is reported as 90.18x + 67.52 and the r = -0.345. What proportion of the variation in y can be explained by the variation in the values of x? s2 = Report answer as a percentage accurate to one decimal place.arrow_forwardYou generate a scatter plot. You then plot the regression line and report the equation and the r2 value. The regression equation is reported as y=−84.57x+32.01 the r2=0.3025What is the correlation coefficient for this data set? r =arrow_forwardYou generate a scatter plot using Excel. You then have Excel plot the trend line and report the equation and the r value. The regression equation is reported as y = – 17.55x + 59.45 and the r? = 0.0081. What is the correlation coefficient for this data set? r =arrow_forward
arrow_back_ios
SEE MORE QUESTIONS
arrow_forward_ios
Recommended textbooks for you
- MATLAB: An Introduction with ApplicationsStatisticsISBN:9781119256830Author:Amos GilatPublisher:John Wiley & Sons Inc
 Probability and Statistics for Engineering and th...StatisticsISBN:9781305251809Author:Jay L. DevorePublisher:Cengage Learning
 Statistics for The Behavioral Sciences (MindTap C...StatisticsISBN:9781305504912Author:Frederick J Gravetter, Larry B. WallnauPublisher:Cengage Learning
  Elementary Statistics: Picturing the World (7th E...StatisticsISBN:9780134683416Author:Ron Larson, Betsy FarberPublisher:PEARSON
 The Basic Practice of StatisticsStatisticsISBN:9781319042578Author:David S. Moore, William I. Notz, Michael A. FlignerPublisher:W. H. Freeman
 Introduction to the Practice of StatisticsStatisticsISBN:9781319013387Author:David S. Moore, George P. McCabe, Bruce A. CraigPublisher:W. H. Freeman
MATLAB: An Introduction with Applications
Statistics
ISBN:9781119256830
Author:Amos Gilat
Publisher:John Wiley & Sons Inc
Probability and Statistics for Engineering and th...
Statistics
ISBN:9781305251809
Author:Jay L. Devore
Publisher:Cengage Learning
Statistics for The Behavioral Sciences (MindTap C...
Statistics
ISBN:9781305504912
Author:Frederick J Gravetter, Larry B. Wallnau
Publisher:Cengage Learning
Elementary Statistics: Picturing the World (7th E...
Statistics
ISBN:9780134683416
Author:Ron Larson, Betsy Farber
Publisher:PEARSON
The Basic Practice of Statistics
Statistics
ISBN:9781319042578
Author:David S. Moore, William I. Notz, Michael A. Fligner
Publisher:W. H. Freeman
Introduction to the Practice of Statistics
Statistics
ISBN:9781319013387
Author:David S. Moore, George P. McCabe, Bruce A. Craig
Publisher:W. H. Freeman