
(a)
Graphical representation of
(a)
Explanation of Solution
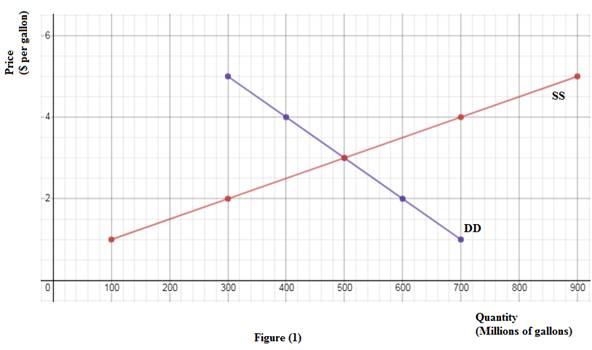
The figure (1) below represents the graphical representation of given demand and supply curves. Here, X- axis measures the quantity (Q) and Y-axis measures price (P).
The downward sloping curve is demand curve (DD) and the upward sloping curve is supply curve (SS).
(b)
Algebraic equation of supply and demand curves.
(b)
Explanation of Solution
As shown in figure (1) above, the given points lie along two straight lines.
Use following point slope formula to calculate algebraic equation:
To calculate algebraic equation of demand curve, plug (700,1) and (600,2) in (1).
To calculate algebraic equation of supply curve, plug (100,1) and (300,2) in (1).
Thus, equations of demand (QD) and supply (QS) curves are as follows:
(c)
Excess demand of the good if the market price is zero.
(c)
Explanation of Solution
Excess demand refers to a situation where market demand is more than market supply at the given market price. It can be calculated by subtracting market demand from market supply.
(d)
(d)
Explanation of Solution
Excess supply refers to a situation where market supply is more than market demand at the given market price. It can be calculated by subtracting market supply from market demand.
Want to see more full solutions like this?
Chapter 1 Solutions
EBK INTERMEDIATE MICROECONOMICS AND ITS

- Suppose that in 2007 Ford sold 500,000 Mustangs at an average price of $18,800 per car; in 2008, 600,000 Mustangs were sold at an average price of $19,500 per car. From these statements what changes in supply or demand on the market for Mustangs produced such changes in equilibrium? (One graph. Start by plotting two points (price versus quantity, shift either supply or demand, not both) and then draw supply and demand graphs through them in a way that explains the change in the equilibrium from 2007 to 2008.arrow_forwardConsider the economy of Russia, which produces oil and cars that are sold both domestically and internationally. Suppose an increase in foreign income causes an increase in the world demand for oil, whereas the supply does not change. The following graph shows the market for oil in Russia. Adjust the following graph to show the effect of a higher demand for oil on the economy of Russia. Note: Select and drag one or both of the curves to the desired position. Curves will snap into position, so if you try to move a curve and it snaps back to its original position, just drag it a little farther.arrow_forwardPlease Help Me: Draw a demand and supply graph for each of the following questions. For each question, start by drawing a correctly labeled graph of the market for cookies in equilibrium. Your starting graphs should each have correctly labeled axes and demand and supply curves. Label the equilibrium price and quantity as p1 and p2 on the axes of each of the starting graphs. Show the effect on the equilibrium price and quantity in the market for cookies if the price of milk increases. Determine which curve is affected by the change in the price of milk and whether it increases or decreases. On your graph, draw a new curve indicating the shift—either to the right or the left. Label the new equilibrium price and quantity as p2 and q2. Show the effect on the equilibrium price and quantity in the market for cookies if the price of flour decreases. Determine which curve is affected by the change in the price of flour and whether it increases or decreases. On your graph, draw a new…arrow_forward
- Supply and Demand Problem Set[1] Use the following graph to answer questions 1 through 3: Plot the following Price and Quantity combinations: (4, 8), (1, 2), (5, 10) Is your graph more likely to be a demand curve or a supply curve? Why? Using the equation of a line, and P for price and Q for quantity, what is the algebraic formula of this curve? Use the following graph to answer questions 4 and 5: Plot the following Price and Quantity combinations. Note that the points are given in the format (Quantity, Price).(0, 50), (2, 40), (4, 30), (6, 20), (8, 10) Using the equation of a line, what is the algebraic formula of this demand curve? Use the following information to answer questions 6 through 10: Suppose the equation of the line changes to . Compute the quantity demanded at each indicated price. Price: $50, Quantity: Price: $40, Quantity: Price: $30, Quantity: Price: $20, Quantity: Price: $10, Quantity: Use the following graph to answer questions 11…arrow_forwardSuppose that when the price of gold is $100 an ounce, gold producers find it unprofitable to sell gold. However, when the price is $200 an ounce, 5000 ounces of output (production) is profitable. At $300, a total of 10,000 ounces of output is profitable. Similarly, total production increases by 5000 ounces for each successive $100 increase in the price of gold. Describe the relevant relationship between the price of gold and the production of gold in words, in a table, and on a graph. Put the price of gold on the vertical axis and the output of gold on the horizontal axis. Comment on the advantages and disadvantages of the verbal, tabular, and graphical forms of description.arrow_forwardSuppose the National Institute of Health publishes a study finding that coffee drinking reduces the probability of getting colon cancer. How do you imagine this will affect the market for coffee? Which determinant of demand or supply is being affected? Show graphically with before and after curves on the same axes. How will this change affect the equilibrium price and quantity of coffee? Explain your reasoning.arrow_forward
- Next, graphically illustrate the supply curve and demand curve for eggs, being certain that you fully label the graph; Then, briefly distinguish the difference between a movement along a curve and a shift of the curve. In doing so, be certain to list in your answer the factors shifting the demand curve as well as the factors shifting the supply curve; Next, graphically illustrate simultaneous shifts of the demand and supply curves for eggs, where there is a small rightward shift of the supply curve and a larger leftward shift of the demand curve, being certain that you fully label the graph. In doing so, be certain your answer includes an explanation of what happens to the equilibrium price and equilibrium quantity of eggs as a result of the shifts and what could have caused the supply curve to shift rightward and what could have caused the demand curve to shift leftward;arrow_forwardHow will each of the following changes in demand and/or supply affect equilibrium price and equilibrium quantity in a competitive market; that is, do price and quantity rise, fall, or remain unchanged, or are the answers indeterminate because they depend on the magnitudes of the shifts? Use supply and demand diagrams to verify your answers.a. Supply decreases and demand is constant.b. Demand decreases and supply is constant.c. Supply increases and demand is constant.d. Demand increases and supply increases.e. Demand increases and supply is constant.f. Supply increases and demand decreases.g. Demand increases and supply decreases.h. Demand decreases and supply decreases.arrow_forwardDraw a demand and supply graph for each of the following questions. For each question, start by drawing a correctly labeled graph of the market for cookies in equilibrium. Your starting graphs should each have correctly labeled axes and demand and supply curves. Label the equilibrium price and quantity as p1 and p2 on the axes of each of the starting graphs. Show the effect on the equilibrium price and quantity in the market for cookies if the price of milk increases. Determine which curve is affected by the change in the price of milk and whether it increases or decreases. On your graph, draw a new curve indicating the shift—either to the right or the left. Label the new equilibrium price and quantity as p2 and q2. Show the effect on the equilibrium price and quantity in the market for cookies if the price of flour decreases. Determine which curve is affected by the change in the price of flour and whether it increases or decreases. On your graph, draw a new curve indicating the…arrow_forward
- The following table shows the weekly demand and supply in the market for shoes in Miami. Based on the preceding table, plot the demand for shoes on the following graph using the blue points (circle symbol). Next, plot the supply of shoes using the orange points (square symbol). Finally, use the black point (plus symbol) to indicate the equilibrium price and quantity in the market for shoes.arrow_forwardIn each of the following cases, determine how supply or demand shifts and how the equilibrium changes. Select the correct answer in each blank space (_______) a. Smartphones: Microchips used in smartphones become less costly to produce. As a result, the __________________( *Supply of and demand for, *Supply of, or *Demand for) smartphones increase(s), causing the equilibrium price to (*Rise, *Fall, or *Rise, fall or remain unchanged) and the equilibrium quantity to (*Rise, fall or remain unchanged, *Rise, *Fall) b. ALS medical research funds: The ALS ice bucket challenge goes viral, leading to greater awareness of the benefits of and need for ALS research. As a result, the _____________ ( *Supply of and demand for, *Supply of, or *Demand for) ALS research increase(s), causing the equilibrium price (or opportunity cost) of such research to __________ (*Rise, fall or remain unchanged, *Rise, *Fall) and the equilibrium quantity to __________ (*Rise, fall or remain…arrow_forwardConstruct a graph (diagram) for this question without an explanation. What will happen to the equilibrium price and quantity of coffee if it is discovered that coffee helps to prevent colds and, at the same time, Brazil and Vietnam emerge in the global market as massive producers of coffee? Assume the responsiveness of supply is greater than the responsiveness of demandarrow_forward
 Exploring EconomicsEconomicsISBN:9781544336329Author:Robert L. SextonPublisher:SAGE Publications, Inc


 Economics (MindTap Course List)EconomicsISBN:9781337617383Author:Roger A. ArnoldPublisher:Cengage Learning