
Bundle: Modern Business Statistics With Microsoft Office Excel, Loose-leaf Version, 6th + Cengagenow, 2 Terms Printed Access Card
6th Edition
ISBN: 9781337589345
Author: David R. Anderson, Dennis J. Sweeney, Thomas A. Williams, Jeffrey D. Camm, James J. Cochran
Publisher: Cengage Learning
expand_more
expand_more
format_list_bulleted
Videos
Textbook Question
Chapter 1, Problem 13SE
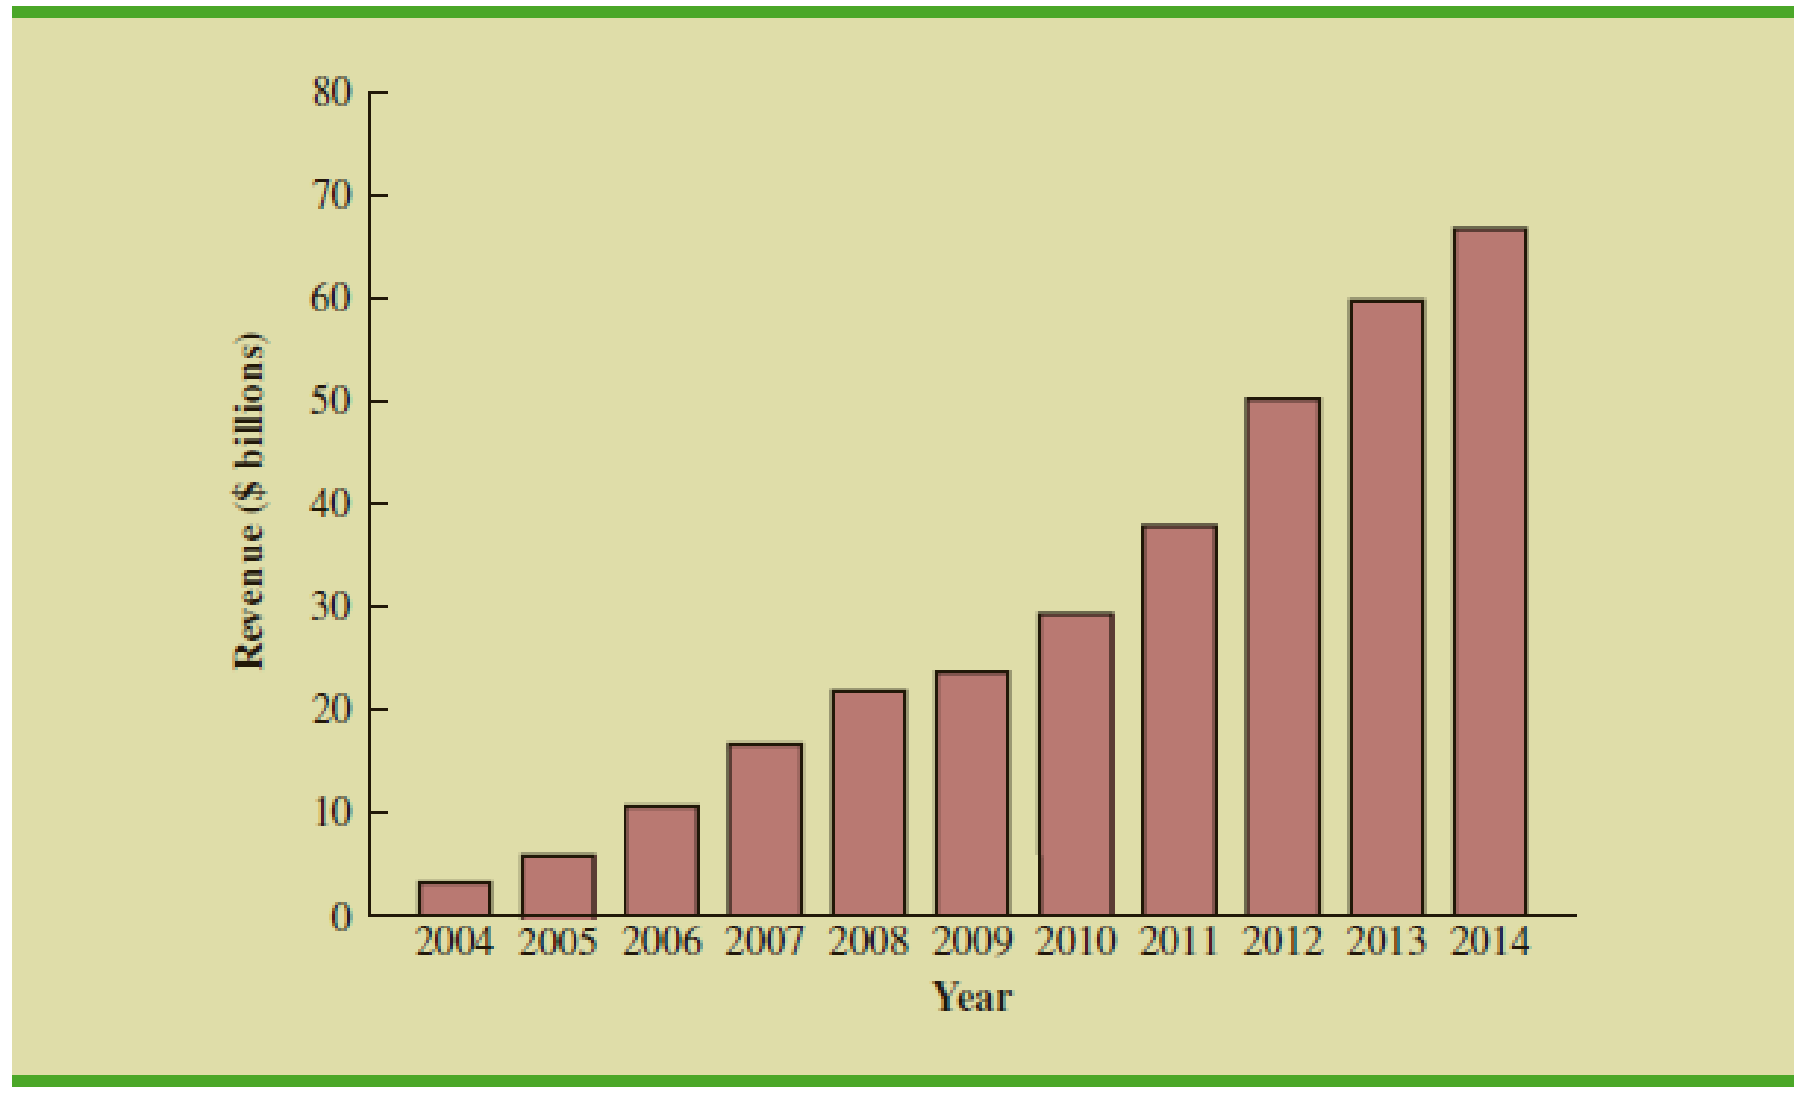
Figure 1.10 provides a bar chart showing the annual revenue for Google from 2004 to 2014. (The Wall Street Journal, August 19, 2014).
- a. What is the variable of interest?
- b. Are the data categorical or quantitative?
- c. Are the data time series or cross-sectional?
- d. Comment on the trend in Google revenue over time.
FIGURE 1.10 G OOGLE REVENUE
Expert Solution & Answer

Trending nowThis is a popular solution!

Chapter 1 Solutions
Bundle: Modern Business Statistics With Microsoft Office Excel, Loose-leaf Version, 6th + Cengagenow, 2 Terms Printed Access Card
Ch. 1 - 1. Discuss the differences between statistics as...Ch. 1 - 2. Tablet PC Comparison provides a wide variety of...Ch. 1 - 3. Refer to Table 1.6.
What is the average cost...Ch. 1 - 4. Table 1.7 shows data for eight cordless...Ch. 1 - 5. Refer to the data set in Table 1.7.
What is the...Ch. 1 - 6. J.D. Power and Associates surveys new...Ch. 1 - 7. The Kroger Company is one of the largest...Ch. 1 - 8. The Tennessean, an online newspaper located in...Ch. 1 - 9. The Commerce Department reported receiving the...Ch. 1 - 10. The Bureau of Transportation Statistics...
Ch. 1 - 11. In a Gallup telephone survey conducted on...Ch. 1 - 12. The Hawaii Visitors Bureau collects data on...Ch. 1 - Figure 1.10 provides a bar chart showing the...Ch. 1 - The following data show the number of rental cars...Ch. 1 - The U.S. Census Bureau tracks sales per month for...Ch. 1 - 17. A manager of a large corporation recommends a...Ch. 1 - 18. A random telephone survey of 1021 adults (aged...Ch. 1 - 19. A Bloomberg Businessweek North American...Ch. 1 - 20. A survey of 131 investment managers in...Ch. 1 - 21. A seven-year medical research study reported...Ch. 1 - Prob. 22SECh. 1 - Pew Research Center is a nonpartisan polling...Ch. 1 - 24. A sample of midterm grades for five students...Ch. 1 -
Table 1.8 shows a data set containing information...
Knowledge Booster


Learn more about
Need a deep-dive on the concept behind this application? Look no further. Learn more about this topic, statistics and related others by exploring similar questions and additional content below.Similar questions
- Table 3 gives the annual sales (in millions of dollars) of a product from 1998 to 20006. What was the average rate of change of annual sales (a) between 2001 and 2002, and (b) between 2001 and 2004?arrow_forwardEnter the data from Table 2 into a graphing calculator and graph the ranking scatter plot. Determine whetherthe data from the table would likely represent a function that is linear, exponential, or logarithmic.arrow_forwardTable 6 shows the year and the number ofpeople unemployed in a particular city for several years. Determine whether the trend appears linear. If so, and assuming the trend continues, in what year will the number of unemployed reach 5 people?arrow_forward
- What does the y -intercept on the graph of a logistic equation correspond to for a population modeled by that equation?arrow_forwardDoes a linear, exponential, or logarithmic model best fit the data in Table 2? Find the model.arrow_forwardTable 6 shows the population, in thousands, of harbor seals in the Wadden Sea over the years 1997 to 2012. a. Let x represent time in years starting with x=0 for the year 1997. Let y represent the number of seals in thousands. Use logistic regression to fit a model to these data. b. Use the model to predict the seal population for the year 2020. c. To the nearest whole number, what is the limiting value of this model?arrow_forward
arrow_back_ios
arrow_forward_ios
Recommended textbooks for you

 College Algebra (MindTap Course List)AlgebraISBN:9781305652231Author:R. David Gustafson, Jeff HughesPublisher:Cengage Learning
 Glencoe Algebra 1, Student Edition, 9780079039897...AlgebraISBN:9780079039897Author:CarterPublisher:McGraw Hill
 Functions and Change: A Modeling Approach to Coll...AlgebraISBN:9781337111348Author:Bruce Crauder, Benny Evans, Alan NoellPublisher:Cengage Learning
College Algebra (MindTap Course List)
Algebra
ISBN:9781305652231
Author:R. David Gustafson, Jeff Hughes
Publisher:Cengage Learning
Glencoe Algebra 1, Student Edition, 9780079039897...
Algebra
ISBN:9780079039897
Author:Carter
Publisher:McGraw Hill
Functions and Change: A Modeling Approach to Coll...
Algebra
ISBN:9781337111348
Author:Bruce Crauder, Benny Evans, Alan Noell
Publisher:Cengage Learning
Time Series Analysis Theory & Uni-variate Forecasting Techniques; Author: Analytics University;https://www.youtube.com/watch?v=_X5q9FYLGxM;License: Standard YouTube License, CC-BY
Operations management 101: Time-series, forecasting introduction; Author: Brandoz Foltz;https://www.youtube.com/watch?v=EaqZP36ool8;License: Standard YouTube License, CC-BY