
Concept explainers
Videos
a.
To explain: The reason for using rates for comparison instead of counts for the number of accidents occurred due to marijuana use.
a.
Answer to Problem 1.40E
The rates can give the accident rate caused by drivers across various categories of marijuana use.
Explanation of Solution
Given info:
A survey was conducted for 907 drivers who aged 21. The survey states that whether the drivers had made accidents and they were asked about marijuana use. The dataset is tabulated into various categories of marijuana use.
Justification:
By converting the number of accidents caused into rates can give the accidents rate for different categories of marijuana use. It would be easy for comparing and making decisions.
b.
To compute: The accident rates across four categories of marijuana use.
To construct: The graph for the accident rates across four categories of marijuana use.
To conclude: The causes and effects of marijuana on drivers.
b.
Answer to Problem 1.40E
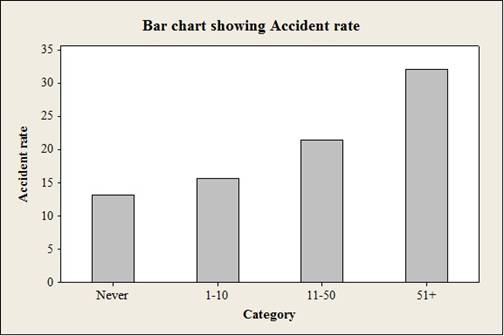
The accident rate across four categories of marijuana use is given as:
| Category | Accident rate |
| Never | 13.1 |
| 1-10 | 15.7 |
| 11-50 | 21.4 |
| 51+ | 32.1 |
Output using the MINITAB software is given below:
The usage of marijuana has possible effects on the number of accidents made by drivers.
Explanation of Solution
Calculation:
Accident rate for “Never” category is calculated as
Thus, the accident rate for the “Never” category is 13.1%
Accident rate for “1-10 times” category is calculated as
Accident rate for “11-50 times” category is calculated as
Thus, the accident rate for “11-50 times” category is 15.7%
Accident rate for “51+ times” category is calculated as
Thus, the accident rate for “51+ times” category is 32.1%
Software procedure:
Step by step procedure to construct the Bar Chart using the MINITAB software:
- Choose Graph > Bar Chart.
- From Bars represent, choose Values from a table.
- Under One column of values, choose Simple. Click OK.
- In Graph variables, enter the column of Accident rate.
- In Categorical variable, enter the column of Category.
- Click OK.
Interpretation:
The bar graph is constructed for the accident rate across four categories of marijuana use.
The horizontal axis represents the categories and vertical axis represents the accident rate.
Also, the bar corresponding to the category 51+ times has the maximum number of accidents.
Justification:
The bar graph shows that there is a possibility of accidents because the accident rate is more when the usage of marijuana is high.
Want to see more full solutions like this?
Chapter 1 Solutions
The Basic Practice of Statistics


 MATLAB: An Introduction with ApplicationsStatisticsISBN:9781119256830Author:Amos GilatPublisher:John Wiley & Sons Inc
 Probability and Statistics for Engineering and th...StatisticsISBN:9781305251809Author:Jay L. DevorePublisher:Cengage Learning
 Statistics for The Behavioral Sciences (MindTap C...StatisticsISBN:9781305504912Author:Frederick J Gravetter, Larry B. WallnauPublisher:Cengage Learning
 Elementary Statistics: Picturing the World (7th E...StatisticsISBN:9780134683416Author:Ron Larson, Betsy FarberPublisher:PEARSON
 The Basic Practice of StatisticsStatisticsISBN:9781319042578Author:David S. Moore, William I. Notz, Michael A. FlignerPublisher:W. H. Freeman
 Introduction to the Practice of StatisticsStatisticsISBN:9781319013387Author:David S. Moore, George P. McCabe, Bruce A. CraigPublisher:W. H. Freeman