
ESSEN OF MOD BUS STAT(LL) W/MIND TAP
7th Edition
ISBN: 9780357195857
Author: Anderson
Publisher: CENGAGE L
expand_more
expand_more
format_list_bulleted
Videos
Textbook Question
Chapter 1, Problem 14SE
The following data show the number of rental cars in service for three rental car companies: Hertz, Avis, and Dollar, over a four-year period.
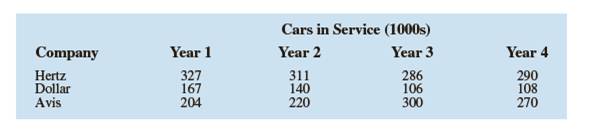
a. Construct a time series graph for the years 1 to 4 showing the number of rental cars in service for each company. Show the time series for all three companies on the same graph.
b. Comment on who appears to be the market share leader and how the market shares are changing over time.
c. Construct a bar chart showing rental cars in service for Year 4. Is this chart based on cross-sectional or time series data?
Expert Solution & Answer
Want to see the full answer?
Check out a sample textbook solution
Students have asked these similar questions
Import Illinois.xls as a table. Using logical indexing to select the years with more than 2800 cases of
Diabetes. Then plot all of the data on the same axis.
F1
fx
Homicide
B
C
E
Year
Accidents
Cancer
Diabetes Heart Disease Homicide|
Suicide
1999
4125
25024
3004
33387
1023
1020
3
2000
4041
25365
2995
31844
991
1003
4.
2001
4077
24778
3092
30990
1087
1139
2002
4222
24737
3011
30821
1016
1145
2003
3942
24464
3044
29816
966
1011
7.
2004
4133
24289
3069
28284
871
1028
8.
2005
4182
24250
3034
28226
866
1086
9.
2006
4451
24084
2795
27007
865
1010
10
2007
4367
24115
2851
25813
863
1108
11
2008
4218
24300
2846
26078
872
1198
12
2009
3961
24185
2741
24931
881
1177
13
2010
3997
24070
2507
24959
783
1178
14
2011
4166
24007
2693
24987
812
1226
15
2012
4488
24562
2706
24667
832
1292
16
2013
4511
24491
2798
17
24839
792
1321
2014
4644
24501
2712
18
25024
792
1398
2015
4850
24713
2817
25652
19
863
1363
20
21
Here are the numbers of robberies in New York City, according to the New York Police Department (NYPD), for 2000 through 2017. Display these data in a graph.
Year:
2000
2001
2002
2003
2004
Count:
32,562
28,202
27,229
25,989
24,373
Year:
2005
2006
2007
2008
2009
Count:
24,722
23,739
21,809
22,401
18,601
Year:
2010
2011
2012
2013
Count:
19,486
19,717
20,144
19,128
Year:
2014
2015
2016
2017
Count:
16,539
16,931
15,500
13,956
Click to download the data in your preferred format.
CSV Excel JMP Mac-Text Minitab PC-Text R SPSS TI CrunchIt!
What are the most important facts that the data show?
The crime rate appears to be leveling off.
The largest percentage decrease in the crime rate was between 2000 and 2001.
In another 17 years, the crime rate will be close to zero.
There were less than half as many robberies in 2017 than there were in 2000.
Robberies decreased overall from 2000 to 2017, with occasional…
Use a graphing calculator to make a scatter plot of the amounts Leah willaccumulate for years 1 through 5.
Chapter 1 Solutions
ESSEN OF MOD BUS STAT(LL) W/MIND TAP
Ch. 1 - Discuss the differences between statistics as...Ch. 1 - Tablet PC Comparison provides a wide variety of...Ch. 1 - Refer to Table 1. 6. a. What is the average cost...Ch. 1 - Table 1. 7 shows data for eight cordless...Ch. 1 - Refer to the data set in Table 1. 7. a. What is...Ch. 1 - J D. Power and Associates surveys new automobile...Ch. 1 - The Kroger Company is one of the largest grocery...Ch. 1 - The Tennessean, an online newspaper located in...Ch. 1 - The Commerce Department reported receiving the...Ch. 1 - The Bureau of Transportation Statistics Omnibus...
Ch. 1 - In a Gallup telephone survey conducted on April...Ch. 1 - The Hawaii Visitors Bureau collects data on...Ch. 1 - Figure 1. 10 provides a bar chart showing the...Ch. 1 - The following data show the number of rental cars...Ch. 1 - The U. S. Census Bureau tracks sales per month for...Ch. 1 - The Energy Information Administration of the U. S....Ch. 1 - A manager of a large corporation recommends a...Ch. 1 - A random telephone survey of 1021 adults (aged 18...Ch. 1 - A Bloomberg Businessweek North American subscriber...Ch. 1 - A survey of 131 investment managers in Barron 's...Ch. 1 - A seven-year medical research study reported that...Ch. 1 - A survey conducted by Better Homes and Gardens...Ch. 1 - Pew Research Center is a nonpartisan polling...Ch. 1 - A sample of midterm grades for five students...Ch. 1 - Table 1. 8 shows a data set containing information...
Knowledge Booster


Learn more about
Need a deep-dive on the concept behind this application? Look no further. Learn more about this topic, statistics and related others by exploring similar questions and additional content below.Similar questions
- A. Movie Theatre Admissions. The following bar graph shows the number of U.S. and Canada movie theatre admissions for the years from 2007 to 2014. 1.50 1.45 1.40 1.35 1.30 1.25 1.20 0.00 2011 2014 Total U.S. and Canada movie theatre admissions SOURCE: National Association of Theatre Owners Question: 1. Estimate the number of admissions for the year 2009. Round to the nearest tenth of a billion. Answer: 2. Which year had the least number of admissions? Answer: 3. Which year had the greatest number of admissions? Answer: | B. Determine whether the argument is an example of inductive reasoning or deductive reasoning. 1. Emma enjoyed reading the novel Finders Keepers by Stephen King, so she will enjoy reading his next novel. Answer: 2. Every English setter likes to hunt. Duke is an English setter, so Duke likes to hunt. Answer: 3. All home improvements cost more than the estimate. The contractor estimated that my home improvement will cost $35,000. Thus my home improvement will cost more…arrow_forwardThe following table provides monthly revenue values for Tedstar, Inc., a company thatsells valves to large industrial firms. The monthly revenue data have been graphed usinga line chart in the following figure. a. What are the problems with the layout and display of this line chart?b. Create a new line chart for the monthly revenue data at Tedstar, Inc. Format the chartto make it easy to read and interpret.arrow_forwardPyramid Lake, Nevada, is described as the pride of the Paiute Indian Nation. It is a beautiful desert lake famous for very large trout. The elevation of the lake surface (feet above sea level) varies according to the annual flow of the Truckee River from Lake Tahoe. Assume that the U.S. Geological Survey provided the following data: Year 1986 1987 1988 1989 1990 1991 1992 1993 Elevation 3817 3815 3810 3812 3808 3803 3798 3797 Year 1994 1995 1996 1997 1998 1999 2000 Elevation 3795 3797 3802 3807 3811 3816 3817 Make a time series graph.arrow_forward
- The owner of Backstone Inc. opened 3 stores in different arts of the city and would like to compare the number of sales transactions made after 2months of operation. The number of sales transactions at the 3 stores are displayed in the chart below:arrow_forwardB. Present the following data in Tabular Form. Stat Mountain Bike Shop has sold 50 bicycles the month of January. Similarly, in the month of February 60 bicycles were sold. While in March the sales go down to 45 and 30 in May.arrow_forwardJohn Kittle, an independent insurance agent, uses a five-year moving average to forecast the number of claims made in a single year for one of the large insurance companies he sells for. He has just discovered that a clerk in his employ incorrectly entered the number of claims made four years ago as 1,400 when it should have been 1,200.a. What adjustment should Mr. Kittle make in next year’s forecast to take into account the corrected value of the number of claims four years ago?b. Suppose that Mr. Kittle used simple exponential smoothing with a = .2instead of moving averages to determine his forecast. What adjustment is now required in next year’s forecast? (Note that you do not need to know the value of the forecast for next year in order to solve this problem.)arrow_forward
- A sales manager would like to see his sales representative’s unit sales per month. The secretary was told to keep a monthly record of the sales. The following are the data from the previous months (in ascending order): 5, 6, 8, 10, 10, 14, 15, 16, 16, 17, 17, 18, 19, 21, 21, 23, 26, 27, 28, 28, 28, 30, 38, 43. With that, complete the frequency distribution table below. Compute for the average sales per month (mean).arrow_forwardThe following data show the number of rental cars in service for three rental car corporations: Henz, Avis and Dollar. The data are for the years 2007-2010 and are in thousands of vehicles (auto Rental News website, May 15, 2011) Company 2007 2008 2009 2010 Hentz 327 311 286 290 Dollar 167 140 106 108 Avis 204 220 300 270 Construct a time series graph for years 2007 and 2010 showing the number of rental cars service for each company. Show the time series for all three companies on the same graph Comment on who appears to be the market share leaders and how market shares are changing over time. Construct a bar chart showing rental cars in service for 2010. Is this chart based on cross sectional or time series data?arrow_forwardAypee kept track of the number of hours he studied each day for a 3-hour week period. The following observations (in hours) were recorded:Week 1: 1.5, 1.0, 0, 1.4, 0, 2.5, 0.8Week 2: 0.5, 2.0, 0.6, 0, 2.5, 1.8, 3.8Week 3: 0, 1.4, 2.2, 1.4, 0, 3.2, 0 Required: What is the modal number of hours studied per day? What is the median number of hours studied per day? What is the mean number of hours studied per dayarrow_forward
- Thirty identical flashlights were loaded with newly purchased alkaline AA batteries. Ten of them contained Duracell, ten contained Energizer, and ten contained Rayovac brand batteries. The flashlights were turned on and placed on a bookshelf where a time-lapse video camera captured how long (in minutes) each beam of light lasted. These times are displayed in the following table. Brand Time (in minutes) of Flashlight Continuous Use with New Alkaline AA Batteries Duracell 244 241 236 239 240 237 243 251 245 232 Energizer 231 240 236 243 246 249 238 247 236 240 Rayovac 178 184 185 167 183 191 166 185 171 182 Use a 0.01 level of significance to conduct a hypothesis test to establish if the mean length of continuous use for this flashlight is equivalent when using either Duracell, Energizer, or Rayovac brand alkaline AA batteries.arrow_forwardThe table below shows the share of income going to each quintile of the income distribution for Neverland in 1980 and 1990. Complete the table below finding the the cumulative share of income for 1980 and 1990 and answer the following: Share of income in Cumulative share of Share of income in Cumulative share of Quintiles 1980 income in 1980 1990 income in 1990 1st 7% 6.6.% 2nd 11.5% 11.5% 3rd 17% 16.3% 4th 24.8% 22.7% 5th 39.7% 42.9% a) Sketch the Perfect Equality line and the Lorenz curve for 1980 and for 1990. Don't forget to label your graph and your curves! b) According to the Lorenz curves that you draw in (a), which year had worse income inequality, 1980 or 1990? JUSTIFY your answer! NOTE: This is a file upload question. Work your answer in a piece of paper, take a picture and upload your file.arrow_forwardJohnson Filtration, Inc. provides maintenance service for water-filtration systems. Suppose that in addition to information on the number of months since the machine was serviced and whether a mechanical or an electrical repair was necessary, the managers obtained a list showing which repairperson performed the service. The revised data follow. Click on the datafile logo to reference the data. DATA file Repair Time Months Since in Hours Last Service Type of Repair Repairperson 2.9 Electrical Dave Newton 3.0 Mechanical Dave Newton 4.8 8. Electrical Bob Jones 1.8 Mechanical Dave Newton 2.9 Electrical Dave Newton 4.9 Electrical Bob Jones 4.2 6. Mechanical Bob Jones 4.8 8. Mechanical Bob Jones 4.4 4. Electrical Bob Jones 4.5 Electrical Dave Newton a. Ignore for now the months since the last maintenance service (1 ) and the repairperson who performed the service. Develop the estimated simpe linear regression equation to predict the repair time (y) given the type of repair (2 ). Recall that…arrow_forward
arrow_back_ios
SEE MORE QUESTIONS
arrow_forward_ios
Recommended textbooks for you
 MATLAB: An Introduction with ApplicationsStatisticsISBN:9781119256830Author:Amos GilatPublisher:John Wiley & Sons Inc
 Probability and Statistics for Engineering and th...StatisticsISBN:9781305251809Author:Jay L. DevorePublisher:Cengage Learning
 Statistics for The Behavioral Sciences (MindTap C...StatisticsISBN:9781305504912Author:Frederick J Gravetter, Larry B. WallnauPublisher:Cengage Learning
 Elementary Statistics: Picturing the World (7th E...StatisticsISBN:9780134683416Author:Ron Larson, Betsy FarberPublisher:PEARSON
 The Basic Practice of StatisticsStatisticsISBN:9781319042578Author:David S. Moore, William I. Notz, Michael A. FlignerPublisher:W. H. Freeman
 Introduction to the Practice of StatisticsStatisticsISBN:9781319013387Author:David S. Moore, George P. McCabe, Bruce A. CraigPublisher:W. H. Freeman
MATLAB: An Introduction with Applications
Statistics
ISBN:9781119256830
Author:Amos Gilat
Publisher:John Wiley & Sons Inc
Probability and Statistics for Engineering and th...
Statistics
ISBN:9781305251809
Author:Jay L. Devore
Publisher:Cengage Learning
Statistics for The Behavioral Sciences (MindTap C...
Statistics
ISBN:9781305504912
Author:Frederick J Gravetter, Larry B. Wallnau
Publisher:Cengage Learning
Elementary Statistics: Picturing the World (7th E...
Statistics
ISBN:9780134683416
Author:Ron Larson, Betsy Farber
Publisher:PEARSON
The Basic Practice of Statistics
Statistics
ISBN:9781319042578
Author:David S. Moore, William I. Notz, Michael A. Fligner
Publisher:W. H. Freeman
Introduction to the Practice of Statistics
Statistics
ISBN:9781319013387
Author:David S. Moore, George P. McCabe, Bruce A. Craig
Publisher:W. H. Freeman
Time Series Analysis Theory & Uni-variate Forecasting Techniques; Author: Analytics University;https://www.youtube.com/watch?v=_X5q9FYLGxM;License: Standard YouTube License, CC-BY
Operations management 101: Time-series, forecasting introduction; Author: Brandoz Foltz;https://www.youtube.com/watch?v=EaqZP36ool8;License: Standard YouTube License, CC-BY