Videos
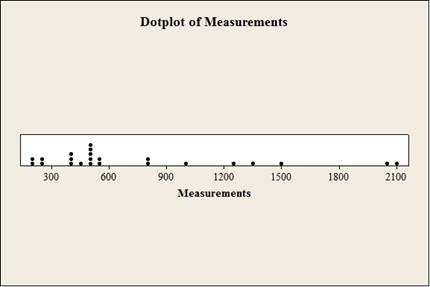
The article “Hydrogeochemical Characteristics of Groundwater in a Mid-Western Coastal Aquifer System” (S. Jeen. J. Kim, et al., Geosciences Journal, 2001:339–348) presents measurements of various properties of shallow groundwater in a certain aquifer system in Korea. Following are measurements of electrical conductivity (in microsiemens per centimeter) for 23 water samples.
2099 528 2030 1350 1018 384 1499
1265 375 424 789 810 522 513
488 200 215 486 257 557 260
461 500
- a. Find the mean.
- b. Find the standard deviation.
- c. Find the median.
- d. Construct a dotplot.
- e. Find the 10% trimmed mean.
- f. Find the first
quartile. - g. Find the third quartile.
- h. Find the
interquartile range . - i. Construct a boxplot.
- j. Which of the points, if any, are outliers?
- k. If a histogram were constructed, would it be skewed to the left, skewed to the right, or approximately symmetric?
a.
Find the mean.
Answer to Problem 16SE
The mean is 740.0.
Explanation of Solution
Given info:
The data shows that the measurements of the electrical conductivity.
Calculation:
Step by step procedure for finding the mean concentration using Minitab software is follows:
- Choose Stat > Basic Statistics > Display Descriptive Statistics.
- In Variables enter the columns Measurements.
- Choose option statistics, and select Mean.
- Click OK.
Output using Minitab software is,
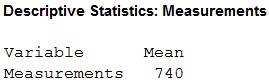
From the output the mean is 74.0.
b.
Find the standard deviation.
Answer to Problem 16SE
The standard deviation is 550.
Explanation of Solution
Calculation:
Step by step procedure for finding the mean concentration using Minitab software is follows:
- Choose Stat > Basic Statistics > Display Descriptive Statistics.
- In Variables enter the columns Measurements.
- Choose option statistics, and select Standard deviation.
- Click OK.
Output using Minitab software is,
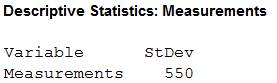
From the output the standard deviation is 550.
c.
Compute the median.
Answer to Problem 16SE
The median is 513.
Explanation of Solution
Calculation:
Step by step procedure for finding the median concentration is follows:
- Choose Stat > Basic Statistics > Display Descriptive Statistics.
- In Variables enter the columns Measurements.
- Choose option statistics, and select Median.
- Click OK.
Output using Minitab software is,
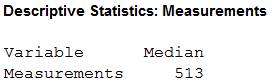
From the output the median is 513.
d.
Construct a dotplot.
Answer to Problem 16SE
The dotplot is,
Explanation of Solution
Calculation:
Step by step procedure to constructing dotplot using Minitab procedure is follows:
- Choose Graph > Dotplot.
- Choose One Y-Simple and then click OK.
- In Graph variables, enter Measurements.
- Click OK.
e.
Compute the 10% trimmed mean.
Answer to Problem 16SE
The 10% trimmed mean is 657.16.
Explanation of Solution
Calculation:
The sample size n is 23.
Trimmed mean:
The trimmed mean is a measure of center that is designed to be unaffected by outliers.
The 10% of the value is,
Therefore, trim the highest 2 and lowest 2 observations from the given data.
The observations after trimmed values are,
| n | Measurements |
| 1 | 257 |
| 2 | 260 |
| 3 | 375 |
| 4 | 384 |
| 5 | 424 |
| 6 | 461 |
| 7 | 486 |
| 8 | 488 |
| 9 | 500 |
| 10 | 513 |
| 11 | 522 |
| 12 | 528 |
| 13 | 557 |
| 14 | 789 |
| 15 | 810 |
| 16 | 1018 |
| 17 | 1265 |
| 18 | 1350 |
| 19 | 1499 |
| Total | 12,486 |
| Mean |
From the table, the trimmed mean is 657.16.
f.
Compute the first quartile.
Answer to Problem 16SE
The first quartile of the concentrations is 384.
Explanation of Solution
Calculation:
Step by step procedure for finding the first quartile of the concentration is follows:
- Choose Stat > Basic Statistics > Display Descriptive Statistics.
- In Variables enter the columns Measurements.
- Choose option statistics, and select First quartile.
- Click OK.
Output using Minitab software is,
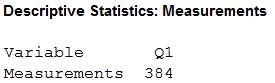
From the output the first quartile is 384.
g.
Compute the third quartile.
Answer to Problem 16SE
The third quartile is 1,018.
Explanation of Solution
Calculation:
Step by step procedure for finding the third quartile of the concentration is follows:
- Choose Stat > Basic Statistics > Display Descriptive Statistics.
- In Variables enter the columns Measurements.
- Choose option statistics, and select Third quartile.
- Click OK.
Output using Minitab software is,
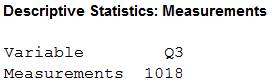
From the output the third quartile is 1,018.
h.
Compute the interquartile range.
Answer to Problem 16SE
The interquartile range is 634.
Explanation of Solution
Calculation:
Step by step procedure for finding the third quartile of the concentration is follows:
- Choose Stat > Basic Statistics > Display Descriptive Statistics.
- In Variables enter the columns Measurements.
- Choose option statistics, and select Interquartile range.
- Click OK.
Output using Minitab software is,
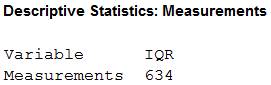
From the output the interquartile range is 634.
i.
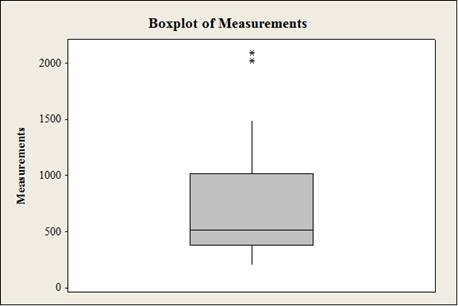
Construct a boxplot for the concentrations.
Answer to Problem 16SE
The boxplot for the given data is,
Explanation of Solution
Calculation:
Step by step procedure to constructing boxplot using Minitab procedure is follows:
- Choose Graph > Boxplot or Stat > EDA > Boxplot.
- Under One Y, choose Simple. Click OK.
- In Graph variables, enter Measurements.
- Click OK.
j.
Identify the points in any outliers.
Answer to Problem 16SE
The points 2,030 and 2,099 are outliers.
Explanation of Solution
Calculation:
Outlier:
If the sample contain a few points that are much larger or smaller than the rest then the points are called outliers.
From the boxplot, it can be concluded that there are two outliers. They are 2,030 and 2,099.
k.
Identify it is skewed to the left, skewed to the right or approximately symmetric if histogram were constructed.
Answer to Problem 16SE
The histogram is skewed to the right.
Explanation of Solution
Calculation:
Left and Right skewed:
If the sample is left skewed then the median is closer to the third quartile than to the first quartile and if the sample is right skewed then the median is closer to the first quartile than to the third quartile.
From the boxplot, it is observed that the median is closer to the first quartile than to the third quartile. That is, the data is skewed to the right.
Therefore, the histogram is skewed to the right.
Want to see more full solutions like this?
Chapter 1 Solutions
STATISTICS FOR ENGR.+SCI-W/ACCESS


- Wild irises are beautiful flowers found throughout the United States, Canada, and northern Europe. This problem concerns the length of the sepal (leaf-like part covering the flower) of different species of wild iris. Data are based on information taken from an article by R. A. Fisher in Annals of Eugenics (Vol. 7, part 2, pp. 179 -188). Measurements of sepal length in centimeters from random samples of Iris setosa (I), Iris versicolor (II), and Iris virginica (III) are as follows below. I II III 5.5 5.2 6.7 4.4 6.5 5.7 5.2 6.9 4.1 5.9 4.4 7.8 4.3 5.5 5.7 5.3 6.4 6.1 5.8 5.5 6.9 Shall we reject or not reject the claim that there are no differences among the population means of sepal length for the different species of iris? Use a 10% level of significance. (a) What is the level of significance? (b) Find SSTOT, SSBET, and SSW and check that SSTOT = SSBET + SSW. (Use 3 decimal places.) SSTOT = ? SSBET = ? SSW = ? Find d.f.BET, d.f.W, MSBET, and…arrow_forwardWild irises are beautiful flowers found throughout the United States, Canada, and northern Europe. This problem concerns the length of the sepal (leaf-like part covering the flower) of different species of wild iris. Data are based on information taken from an article by R. A. Fisher in Annals of Eugenics (Vol. 7, part 2, pp. 179 -188). Measurements of sepal length in centimeters from random samples of Iris setosa (I), Iris versicolor (II), and Iris virginica (III) are as follows below. I II III 5.5 5.2 6.8 4.6 6.5 5.3 5.1 6.1 4.4 5.5 4.1 7.9 4.1 5.1 5.9 5.4 6.1 6.9 5.4 5.1 6.6 Shall we reject or not reject the claim that there are no differences among the population means of sepal length for the different species of iris? Use a 5% level of significance. (a) What is the level of significance?State the null and alternate hypotheses. Ho: ?1 = ?2 = ?3; H1: Exactly two means are equal.Ho: ?1 = ?2 = ?3; H1: Not all the means are equal. Ho: ?1 = ?2 = ?3; H1:…arrow_forwardWild irises are beautiful flowers found throughout the United States, Canada, and northern Europe. This problem concerns the length of the sepal (leaf-like part covering the flower) of different species of wild iris. Data are based on information taken from an article by R. A. Fisher in Annals of Eugenics (Vol. 7, part 2, pp. 179 -188). Measurements of sepal length in centimeters from random samples of Iris setosa (I), Iris versicolor (II), and Iris virginica (III) are as follows below. I II III 5.7 5.1 6.5 4.7 6.2 5.1 4.7 6.6 4.7 5.8 4.9 7.5 4.6 5.2 5.3 5.3 6.2 6.2 5.4 5.8 6.4 (b) Find SSTOT, SSBET, and SSW and check that SSTOT = SSBET + SSW. (Use 3 decimal places.) SSTOT = SSBET = SSW = Find d.f.BET, d.f.W, MSBET, and MSW. (Use 4 decimal places for MSBET, and MSW.) dfBET = dfW = MSBET = MSW = Find the value of the sample F statistic. (Use 2 decimal places.)What are the degrees of freedom? (numerator) (denominator)arrow_forward
- Wild irises are beautiful flowers found throughout the United States, Canada, and northern Europe. This problem concerns the length of the sepal (leaf-like part covering the flower) of different species of wild iris. Data are based on information taken from an article by R. A. Fisher in Annals of Eugenics (Vol. 7, part 2, pp. 179 -188). Measurements of sepal length in centimeters from random samples of Iris setosa (I), Iris versicolor (II), and Iris virginica (III) are as follows below. I II III 5.9 5.8 6.9 4.8 6.5 5.6 4.6 6.4 4.9 5.7 4.3 7.7 4.8 5.8 5.6 5.4 6.3 6.3 5.8 5.5 6.6 Shall we reject or not reject the claim that there are no differences among the population means of sepal length for the different species of iris? Use a 5% level of significance. (b) Find SSTOT, SSBET, and SSW and check that SSTOT = SSBET + SSW. (Use 3 decimal places.) SSTOT = SSBET = SSW = Find d.f.BET, d.f.W, MSBET, and MSW. (Use 4 decimal places for MSBET, and…arrow_forwardWild irises are beautiful flowers found throughout the United States, Canada, and northern Europe. This problem concerns the length of the sepal (leaf-like part covering the flower) of different species of wild iris. Data are based on information taken from an article by R. A. Fisher in Annals of Eugenics (Vol. 7, part 2, pp. 179 -188). Measurements of sepal length in centimeters from random samples of Iris setosa (I), Iris versicolor (II), and Iris virginica (III) are as follows below. I II III 5.6 5.5 6.9 4.5 6.6 5.5 5.4 6.5 4.3 5.4 4.6 7.9 4.7 5.6 5.8 5.9 6.6 6.3 5.6 5.6 6.9 Shall we reject or not reject the claim that there are no differences among the population means of sepal length for the different species of iris? (b) Find SSTOT, SSBET, and SSW and check that SSTOT = SSBET + SSW. (Use 3 decimal places.) SSTOT = SSBET = SSW = Find d.f.BET, d.f.W, MSBET, and MSW. (Use 4 decimal places for MSBET, and MSW.) dfBET = dfW =…arrow_forwardAn article in the ASCE Journal of Energy Engineering [“Overview of Reservoir Release Improvements at 20 TVA Dams” (Vol. 125, April 1999, pp. 1–17)] presents data on dissolved oxygen concentrations in streams below 20 dams in the Tennessee Valley Authority system. The observations are (in milligrams per liter):arrow_forward
- The Turbine Oil Oxidation Test (TOST) and the Rotating Bomb Oxidation Test (RBOT) are two different procedures for evaluating the oxidation stability of steam turbine oils. An article reported the accompanying observations on x = TOST time (hr) and y = RBOT time (min) for 12 oil specimens. TOST 4200 3600 3750 3650 4050 2770 RBOT 370 345 375 315 350 205 TOST 4870 4525 3450 2700 3750 3325 RBOT 400 380 285 220 345 290 (a) Calculate the value of the sample correlation coefficient. (Round your answer to four decimal places.) r = Carry out a test of hypotheses to decide whether RBOT Time and TOST time are linearly related. (Use ? = 0.05.) Calculate the test statistic and determine the P-value. (Round your test statistic to two decimal places and your P-value to three decimal places.) t = P-value =arrow_forwardThe spike stature of the plants grown from the seeds of the porcine separates (Dactylis glomerata L) collected from the University campus and İbradı Eynif pasture are given below. In this plant, compare whether there is a difference between regions in terms of spike height. Virgo Height (cm) Data obtained from plants collected from university campus 5 6 8 7 8 6 5 5 4 6 6 Data obtained from plants collected from Eynif pasture 12 9 11 9 9 11 9 10 11 10 Note: Your results interpretation according to two different possibilities (Do it separately, assuming that it is 0.07 and 0.04).arrow_forwardThe article “Snow Cover and TemperatureRelationships in North America and Eurasia” (J.Climate and Applied Meteorology, 1983: 460–469) usedstatistical techniques to relate the amount of snow coveron each continent to average continental temperature.Data presented there included the following ten observationson October snow cover for Eurasia during the years1970–1979 (in million km2):6.5 12.0 14.9 10.0 10.7 7.9 21.9 12.5 14.5 9.2What would you report as a representative, or typical,value of October snow cover for this period, and whatprompted your choice?arrow_forward
- Researchers interested in lead exposure due to car exhaust sampled the blood of 52 police officers subjected to constant inhalation of automobile exhaust fumes while working traffic enforcement in a primarily urban environment. The blood samples of these officers had an average lead concentration of 124.32 µg/l and a SD of 37.74 µg/l; a previous study of individuals from a nearby suburb, with no history of exposure, found an average blood level concentration of 35 µg/l. Test the hypothesis that the downtown police officers have a higher lead exposure than the group in the previous study. Interpret your results in context. Based on your preceding result, without performing a calculation, would a 99% confidence interval for the average blood concentration level of police officers contain 35 µg/l? Based on your preceding result, without performing a calculation, would a 99% confidence interval for this difference contain 0? Explain why or why not.arrow_forwardThe article in the ASCE Journal of Energy Engineering (1999, Vol. 125, pp.59-75) describes a study of the thermal inertia properties of autoclaved aerated concrete used as a building material. Five samples of the material were tested in a structure, and the average interior temperatures (°C) reported were as follows: 23.01, 22.22, 22.04, 22.62, and 22.59. Test that the average interior temperature is equal to 22.5°C using alpha (a) = 0.05. This problem is a test on what population parameter? What is the null and alternative hypothesis? What are the Significance level and type of test? What standardized test statistic will be used? What is the standard test statistic? What is the Statistical Decision? What is the statistical decision in the statement form?arrow_forwardHere is a dataset containing plant growth measurements of plants grown in solutions of commonly-found chemicals in roadway runoff.Phragmites australis, a fast-growing non-native grass common to roadsides and disturbed wetlands of Tidewater Virginia, was grown in a greenhouse and watered with either: Distilled water (control); A weak petroleum solution (representing standard roadway runoff); Sodium chloride solution; Magnesium chloride solution; De-icing brine (50% sodium chloride and 50% magnesium chloride).Twenty grass preparations were used for each solution, and total growth (in cm) was recorded after watering every other day for 40 days.-Perform the correct statistical test to determine the p-value.-Report your answer rounded to four decimal places.-You should use formulas, functions, and the Data Analysis ToolPak in MS Excel to avoid additive rounding errors. Here are some useful functions: =t.test(array1,array2,tails,type) Produces a p-value for any…arrow_forward
 MATLAB: An Introduction with ApplicationsStatisticsISBN:9781119256830Author:Amos GilatPublisher:John Wiley & Sons Inc
 Probability and Statistics for Engineering and th...StatisticsISBN:9781305251809Author:Jay L. DevorePublisher:Cengage Learning
 Statistics for The Behavioral Sciences (MindTap C...StatisticsISBN:9781305504912Author:Frederick J Gravetter, Larry B. WallnauPublisher:Cengage Learning
 Elementary Statistics: Picturing the World (7th E...StatisticsISBN:9780134683416Author:Ron Larson, Betsy FarberPublisher:PEARSON
 The Basic Practice of StatisticsStatisticsISBN:9781319042578Author:David S. Moore, William I. Notz, Michael A. FlignerPublisher:W. H. Freeman
 Introduction to the Practice of StatisticsStatisticsISBN:9781319013387Author:David S. Moore, George P. McCabe, Bruce A. CraigPublisher:W. H. Freeman