
Concept explainers
Videos
The Wall Street Journal’s website, www.wsj.com, reported the number of cars and light-duty trucks sold by the eight largest automakers in the first 2 months of 2013. Compare the 2013 data to the first 2 months of 2009 as reported below.
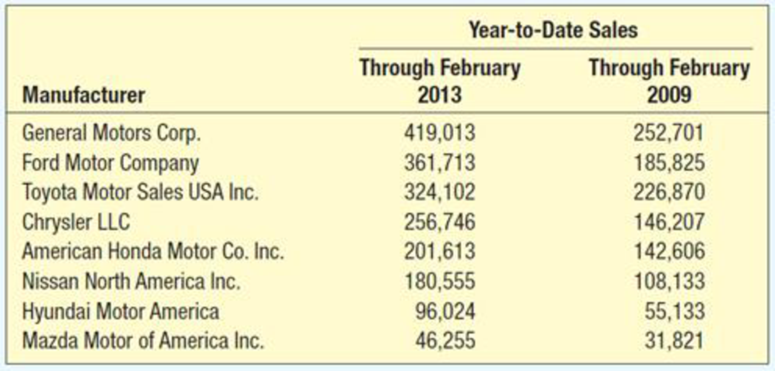
- a. Compare the total sales for the eight automakers. Has there been an increase or a decrease in sales for 2013 compared to the same period in 2009?
- b. The total number of cars and light-duty trucks sold in 2013 was 2.234 million while 1.346 million were sold in 2009. Compute the market share for each of the companies. Has there been a change in the market share for any of the companies?
- c. Compute the percentage change in sales for each of the eight companies. Which companies had a significant change in sales?
a.
Compare the total sales of the given eight automakers.
Check whether there is a change in sales for 2013 when compared to the sales in 2009.
Answer to Problem 17CE
The total sales of the eight automakers increased by 736,725 in 2013 when compared to the year 2009.
Explanation of Solution
The total sales of eight automakers through February 2013 is 18,86,021 and the total sales of eight automakers through February 2009 is 1,149,296.
The difference in total sales of the given eight automakers between 2009 and 2013 is computed as follows:
That is, the total sales in 2013 is increased by 736,725 when compared to the total sales in 2009, which is approximately 64.1%
b.
.
Calculate the market share for each of the companies.
Answer to Problem 17CE
The market share for each of the companies are as follows:
| Manufacturer | Market share in 2013 | Market share in 2009 |
| Company G | 18.76% | 18.77% |
| Company F | 16.19% | 13.81% |
| Company T | 14.51% | 16.86% |
| Company C | 11.49% | 10.86% |
| Company A | 9.02% | 10.59% |
| Company N | 8.08% | 8.03% |
| Company H | 4.30% | 4.10% |
| Company M | 2.07% | 2.36% |
Explanation of Solution
It is given that the total number of cars and light-duty trucks sold in 2013 is 2,234,000 and in 2009 is 1,346,000.
The market share for each of the companies is calculated as follows:
| Manufacturer | Market share in 2013 | Market share in 2009 |
| Company G | ||
| Company F | ||
| Company T | ||
| Company C | ||
| Company A | ||
| Company N | ||
| Company H | ||
| Company M |
Thus, the market share for each company is obtained.
c.
Calculate the percentage change in sales for each of the eight companies.
Identify the company that has a significant change in sales.
Answer to Problem 17CE
The percentage change in sales for each of the eight companies are as follows:
| Manufacturer | Change (%) |
| Company G | 65.81% |
| Company F | 94.65% |
| Company T | 42.86% |
| Company C | 75.60% |
| Company A | 41.38% |
| Company N | 66.97% |
| Company H | 74.17% |
| Company M | 45.36% |
Explanation of Solution
The percentage change in sales for each of the eight companies are calculated as follows:
| Manufacturer | Change (%) |
| Company G | |
| Company F | |
| Company T | |
| Company C | |
| Company A | |
| Company N | |
| Company H | |
| Company M |
It is clear that Company F has the largest percentage change of 94.65%. Whereas, the Companies T, A, and M have the smallest percentage change. These three companies have percentage change of around%.
Want to see more full solutions like this?
Chapter 1 Solutions
STAT TECHNIQUES IN BUSI 2370 >CI<


- Two-fifths of the songs in Mariel’s playlist are country. If there are 16 country songs, what is the total number of songs in the playlist?arrow_forwardFour-fifths of the people on a hike are children. If there are 12 children, what is the total number of people on the hike?arrow_forwardIf a man has 4 sweaters and 5 pairs of slacks, how many different outfit can he wear?arrow_forward
 Algebra: Structure And Method, Book 1AlgebraISBN:9780395977224Author:Richard G. Brown, Mary P. Dolciani, Robert H. Sorgenfrey, William L. ColePublisher:McDougal Littell
 Elementary AlgebraAlgebraISBN:9780998625713Author:Lynn Marecek, MaryAnne Anthony-SmithPublisher:OpenStax - Rice University
 College Algebra (MindTap Course List)AlgebraISBN:9781305652231Author:R. David Gustafson, Jeff HughesPublisher:Cengage Learning
 Glencoe Algebra 1, Student Edition, 9780079039897...AlgebraISBN:9780079039897Author:CarterPublisher:McGraw Hill