
Videos
PERFORMANCE LAWN EQUIPMENT
In each chapter of this book, we use a fictitious company, Performance Lawn Equipment (PLE), within a case exercise for applying the tools and techniques introduced in the chapter.31 To put the case in perspective, we first provide some background about the company, so that the applications of business analytic tools will be more meaningful.
PLE, headquartered in St. Louis, Missouri, is a privately owned designer and producer of traditional lawn mowers used by homeowners. In the past ten years, PLE has added another key product, a medium-size diesel power lawn tractor with front and rear power takeoffs, Class I three-point hitches, four-wheel drive, power steering, and full hydraulics. This equipment is built primarily for a niche market consisting of large estates, including golf and country clubs, resorts, private estates, city parks, large commercial complexes, lawn care service providers, private homeowners with five or more acres, and government (federal, state, and local) parks, building complexes, and military bases. PLE provides most of the products to dealerships, which, in turn, sell directly to end users. PLE employs 1,660 people worldwide. About half the workforce is based in St. Louis; the remainder is split among their manufacturing plants.
In the United States, the focus of sales is on the eastern seaboard, California, the Southeast, and the south central states, which have the greatest concentration of customers. Outside the United States, PLE’s sales include a European market, a growing South American market, and developing markets in the Pacific Rim and China.
Both end users and dealers have been established as important customers for PLE. Collection and analysis of end-user data showed that satisfaction with the products depends on high quality, easy attachment/dismount of implements, low maintenance, price value, and service. For dealers, key requirements are high quality, parts and feature availability, rapid restock, discounts, and timeliness of support.
PLE has several key suppliers: Mitsitsiu, Inc., the sole source of all diesel engines; LANTO Axles, Inc., which provides tractor axles; Schorst Fabrication, which provides subassemblies; Cuberillo, Inc, supplier of transmissions; and Specialty Machining, Inc., a supplier of precision machine parts.
To help manage the company, PLE managers have developed a “balanced scorecard” of measures. These data, which are summarized shortly, are stored in the form of a Microsoft Excel workbook (Performance Lawn Equipment) accompanying this book. The database contains various measures captured on a monthly or quarterly basis and is used by various managers to evaluate business performance. Data for each of the key measures are stored in a separate worksheet. A summary of these worksheets is given next:
- Dealer Satisfaction, measured on a scale of 1–5 (1 = poor, 2 = less than average, 3 = average, 4 = above average, and 5 = excellent). Each year, dealers in each region are surveyed about their overall satisfaction with PLE. The worksheet contains summary data from surveys for the past five years.
- End-User Satisfaction, measured on the same scale as dealers. Each year, 100 users from each region are surveyed. The worksheet contains summary data for the past five years.
- Customer Survey, results from a survey for customer ratings of specific attributes of PLE tractors: quality, ease of use, price, and service on the same 1–5 scale. This sheet contains 200 observations of customer ratings. Complaints, which shows the number of complaints registered by all customers each month in each of PLE’s five regions (North America, South America, Europe, the Pacific, and China).
- Mower Unit Sales and Tractor Unit Sales, which provide sales by product by region on a monthly basis. Unit sales for each region are aggregated to obtain world sales figures.
- Industry Mower Total Sales and Industry Tractor Total Sales, which list the number of units sold by all producers by region.
- Unit Production Costs, which provides monthly accounting estimates of the variable cost per unit for manufacturing tractors and mowers over the past five years.
- Operating and Interest Expenses, which provides monthly administrative, depreciation, and interest expenses at the corporate level.
- On-Time Delivery, which provides the number of deliveries made each month from each of PLE’s major suppliers, the number on time, and the percent on time.
- Defects After Delivery, which shows the number of defects in supplier-provided material found in all shipments received from suppliers.
- Time to Pay Suppliers, which provides measurements in days from the time the invoice is received until payment is sent.
- Response Time, which gives samples of the times taken by PLE customer-service personnel to respond to service calls by quarter over the past two years.
- Employee Satisfaction, which provides data for the past four years of internal surveys of employees to determine their overall satisfaction with their jobs, using the same scale used for customers. Employees are surveyed quarterly, and results are stratified by employee category: design and production, managerial, and sales/administrative support.
In addition to these business measures, the PLE database contains worksheets with data from special studies:
- Engines, which lists 50 samples of the time required to produce a lawn mower blade using a new technology.
- Transmission Costs, which provides the results of 30 samples each for the current process used to produce tractor transmissions and two proposed new processes.
- Blade Weight, which provides samples of mower blade weights to evaluate the consistency of the production process.
- Mower Test, which lists test results of mower
functional performance after assembly for 30 samples of 100 units each. - Employee Retention, data from a study of employee duration (length of hire) with PLE. The 40 subjects were identified by reviewing hires from ten years prior and identifying those who were involved in managerial positions (either hired into management or promoted into management) at some time in this ten year period.
- Shipping Cost, which gives the unit shipping cost for mowers and tractors from existing and proposed plants for a supply chain design study.
- Fixed Cost, which lists the fixed cost to expand existing plants or build new facilities, also as part of the supply chain design study.
- Purchasing Survey, which provides data obtained from a third-party survey of purchasing managers of customers of Performance Lawn Care.
Elizabeth Burke has recently joined the PLE management team to oversee production operations. She has reviewed the types of data that the company collects and has assigned you the responsibility to be her chief analyst in the coming weeks. She has asked you to do some preliminary analysis of the data for the company.
- 1. First, she would like you to edit the worksheets Dealer Satisfaction and End-User Satisfaction to display the total number of responses to each level of the survey scale across all regions for each year.
- 2. Second, she wants a count of the number of failures in the worksheet Mower Test.
- 3. Next, Elizabeth has provided you with prices for PLE products for the past five years:
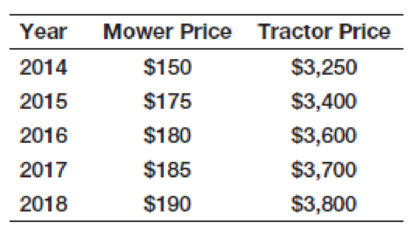
Create a new worksheet to compute gross revenues by month and region, as well as worldwide totals, for each product using the data in Mower Unit Sales and Tractor Unit Sales.
- 4. Finally, she wants to know the market share for each product and region by month based on the PLE and industry sales data, and the average market share by region over the five years.
Summarize all your findings in a report to Ms. Burke.
Want to see the full answer?
Check out a sample textbook solution
Chapter 1 Solutions
Business Analytics


- A school mathematics teacher realises that this routine does not offer learners withthe opportunity to meaningfully learn mathematics. He/she is willing to explore themeaningful learning of Mathematics in his/her class.3.1. Analyse and evaluate the role of problem-solving in the teaching and learning ofMathematics in your classroom. Explain, illustrate and motivate your arguments bymeans of a mathematical idea or concept from school algebra.arrow_forwardThe aim of this prac is to practice data gathering. Assume that you have been employed to improve the user experience of an interactive product such as a smartphone app, a digital media player, a Blu-ray player, computer software, or some other type of technology (you choose anything you can easily observe with the people around you). This existing product may be redesigned, or a completely new product may be created. To do the assignment, find a group of people or a single individual prepared to be the user group. These could be your family, friends, peers, or people in a local community group. For this assignment: Identify the product here: [1] Clarify the basic goal of improving the product by considering what this means in your circumstances. Watch the group (or person) casually to get an understanding of any issues that might create challenges for this activity and any information to help refine the study goals. [3] Explain how you would use each of the three data gathering…arrow_forwardRead the following scenario describing a research project, and then write a short criticism of this project. You should clearly identify at least four aspects of the project which you believe are incorrect or poor. These may relate to the research question, the experimental design, the analysis and reporting, and/or any ethical or academic misconduct issues. For each criticism which you identify, clearly describe the problem and state how it should have been addressed to improve the quality of the research. Question 15.A company providing on-line teaching software claims that students who are on-line students achieve better results on learning programming languages than on campus students. The company has developed a hypothesis based on this claim. The company chose one university to conduct research to test this hypothesis. It applied for research ethics clearance and at the same time included both on-line and oncampus students to participate in this experiment. At the end of…arrow_forward
- Which of the following best describes a characteristic of action research?A. It engages participants in the diagnosis and solution of social problems identified bygovernments and researchers.B. It aims to be inclusive of viewpoints expressed by different groups about social problemsin a research setting.C. It aims to change participants' circumstances in a research setting by seeking a convenientsolution to social problems.D. It produces reliable data because it stands on the side of research participants in the studyof social problems.arrow_forwardNorthwoods Backpackers is a mail-order operation special-izing in outdoor camping and hiking equipment and cloth-ing. In addition to its normal pool of telephone operators to take customer orders, the company has a group of customerservice operators to respond to customer complaints andproduct-related inquiries. The time required for customerservice operators to handle customer calls differs, based onan operator’s ability to think fast and quickly recall from memory product information (without using product de-scription screens on the computer). The company wants to determine the standard time required for a customer serviceoperator to complete a call without having to resort to a timestudy. Instead, management had a work sampling study of an operator conducted during an eight-hour workday that in-cluded 160 observations. The study showed the operator was talking to customers only 78% of the time, and call records indicated that the operator handled 120 customer calls dur-ing the day.…arrow_forwardA researcher is investigating a new screening tool that is intended to help prevent the onset of breast cancer in young women. Suppose he tests the new device on a group of 10 women. The following table shows the test result and true breast cancer status of each of the women. What can we say about the new device with regards to its accuracy? Patient Test Result True Cancer Status A + + B + + C + - D + - E - + F - + G + - H - + I - - J + -arrow_forward
- A researcher replicates a past study manipulating the physical attractiveness of a defendant by using photographs instead of written descriptions, which was how the manipulation occurred in the original study. This technique would be an example of _____ replication. a. direct b. exact c. conceptual d. proceduralarrow_forwardThe ABC corporation is opening new retail sales outlets and they want to staff these stores with employees most likely to be successful at selling the products. To meet this goal, ABC decides to study the sales staff at existing stores to determine if intelligence and extroversion (i.e., a friendly and outgoing personality) predict sales performance of current employees. ABC's logic is that if intelligence and extroversion predicts sales performance, then a good strategy for new stores is to hire intelligent extroverts for the sales positions. To conduct the study, all current retail sales employees at existing stores take psychological tests designed to measure intelligence and extroversion. Also, past sales performance data is checked for each employee. In the end, there are three scores for each sales person: 1. an intelligence score (on a scale of 50-low intelligence to 150-high intelligence), 2. an extroversion score (on a scale of 15-low extroversion to 30-high extroversion), and…arrow_forwardAn analyst in the real estate business is interested in the relationship between the cost of the monthly rent of an apartment and the size of an apartment, in big cities. She gathers data for apartment buildings in 12 cities in 12 different states. In each city, she gets the numbers for at least 5 different buildings and at least 40 apartments in each building. She reaches the following conclusion: the rental cost of a 2-bedroom apartment is 50% more than the rental cost of a 1-bedroom apartment, and the rental cost of a 3-bedroom apartment is 50% more than the rental cost of a 2-bedroom apartment. Based on the paragraph, what is the minimum number of apartments she collected data on? Do you think her sample was large enough to be statistically valid? Based on the paragraph, are there any apartments or apartment buildings that she would have excluded from her study? Do you see any bias in how she selected apartments for her study? Based on the paragraph, is there a positive…arrow_forward
- The basketball coach at a local college believes that his team scores more points at home games when more people show up. Below is a list of all home games last year with scores and corresponding attendance. Use Excel, SPSS, or work by hand to show your work finding r. Show your work on the attached pages. Score Attendance Score Attendance 54 380 67 410 57 350 78 215 59 320 67 113 80 478 56 250 82 451 85 450 75 250 101 489 73 489 99 472 53 451 a. What is the correlation between Score and Attendance rounded to 2 decimals? b. In terms of strength and direction, how would you describe this correlation? c. What is the obtained t-score for this correlation? d. What is the critical t-score for a two-tailed test with a ? e. Is this correlation significant based on the t-scores? f. Based on Table 10.4, approximately how many cases would you expect to need to…arrow_forwardThe basketball coach at a local college believes that his team scores more points at home games when more people show up. Below is a list of all home games last year with scores and corresponding attendance. Use Excel, SPSS, or work by hand to show your work finding r. Show your work on the attached pages. Score Attendance Score Attendance 54 380 67 410 57 350 78 215 59 320 67 113 80 478 56 250 82 451 85 450 75 250 101 489 73 489 99 472 53 451 What is the obtained t-score for this correlation? What is the critical t-score for a two-tailed test with a = 0.05? Is this correlation significant based on the t-scores?arrow_forwardUse the information in the scenario provided to prepare a managerial report for Office Equipment, Inc. (OEI). Scenario Office Equipment, Inc. (OEI) leases automatic mailing machines to business customers in Fort Wayne, Indiana. The company built its success on a reputation of providing timely maintenance and repair service. Each OEI service contract states that a service technician will arrive at a customer’s business site within an average of 3 hours from the time that the customer notifies OEI of an equipment problem. Currently, OEI has 10 customers with service contracts. One service technician is responsible for handling all service calls. A statistical analysis of historical service records indicates that a customer requests a service call at an average rate of one call per 50 hours of operation. If the service technician is available when a customer calls for service, it takes the technician an average of 1 hour of travel time to reach the customer’s office and an average of 1.5…arrow_forward
 Big Ideas Math A Bridge To Success Algebra 1: Stu...AlgebraISBN:9781680331141Author:HOUGHTON MIFFLIN HARCOURTPublisher:Houghton Mifflin Harcourt