
Videos
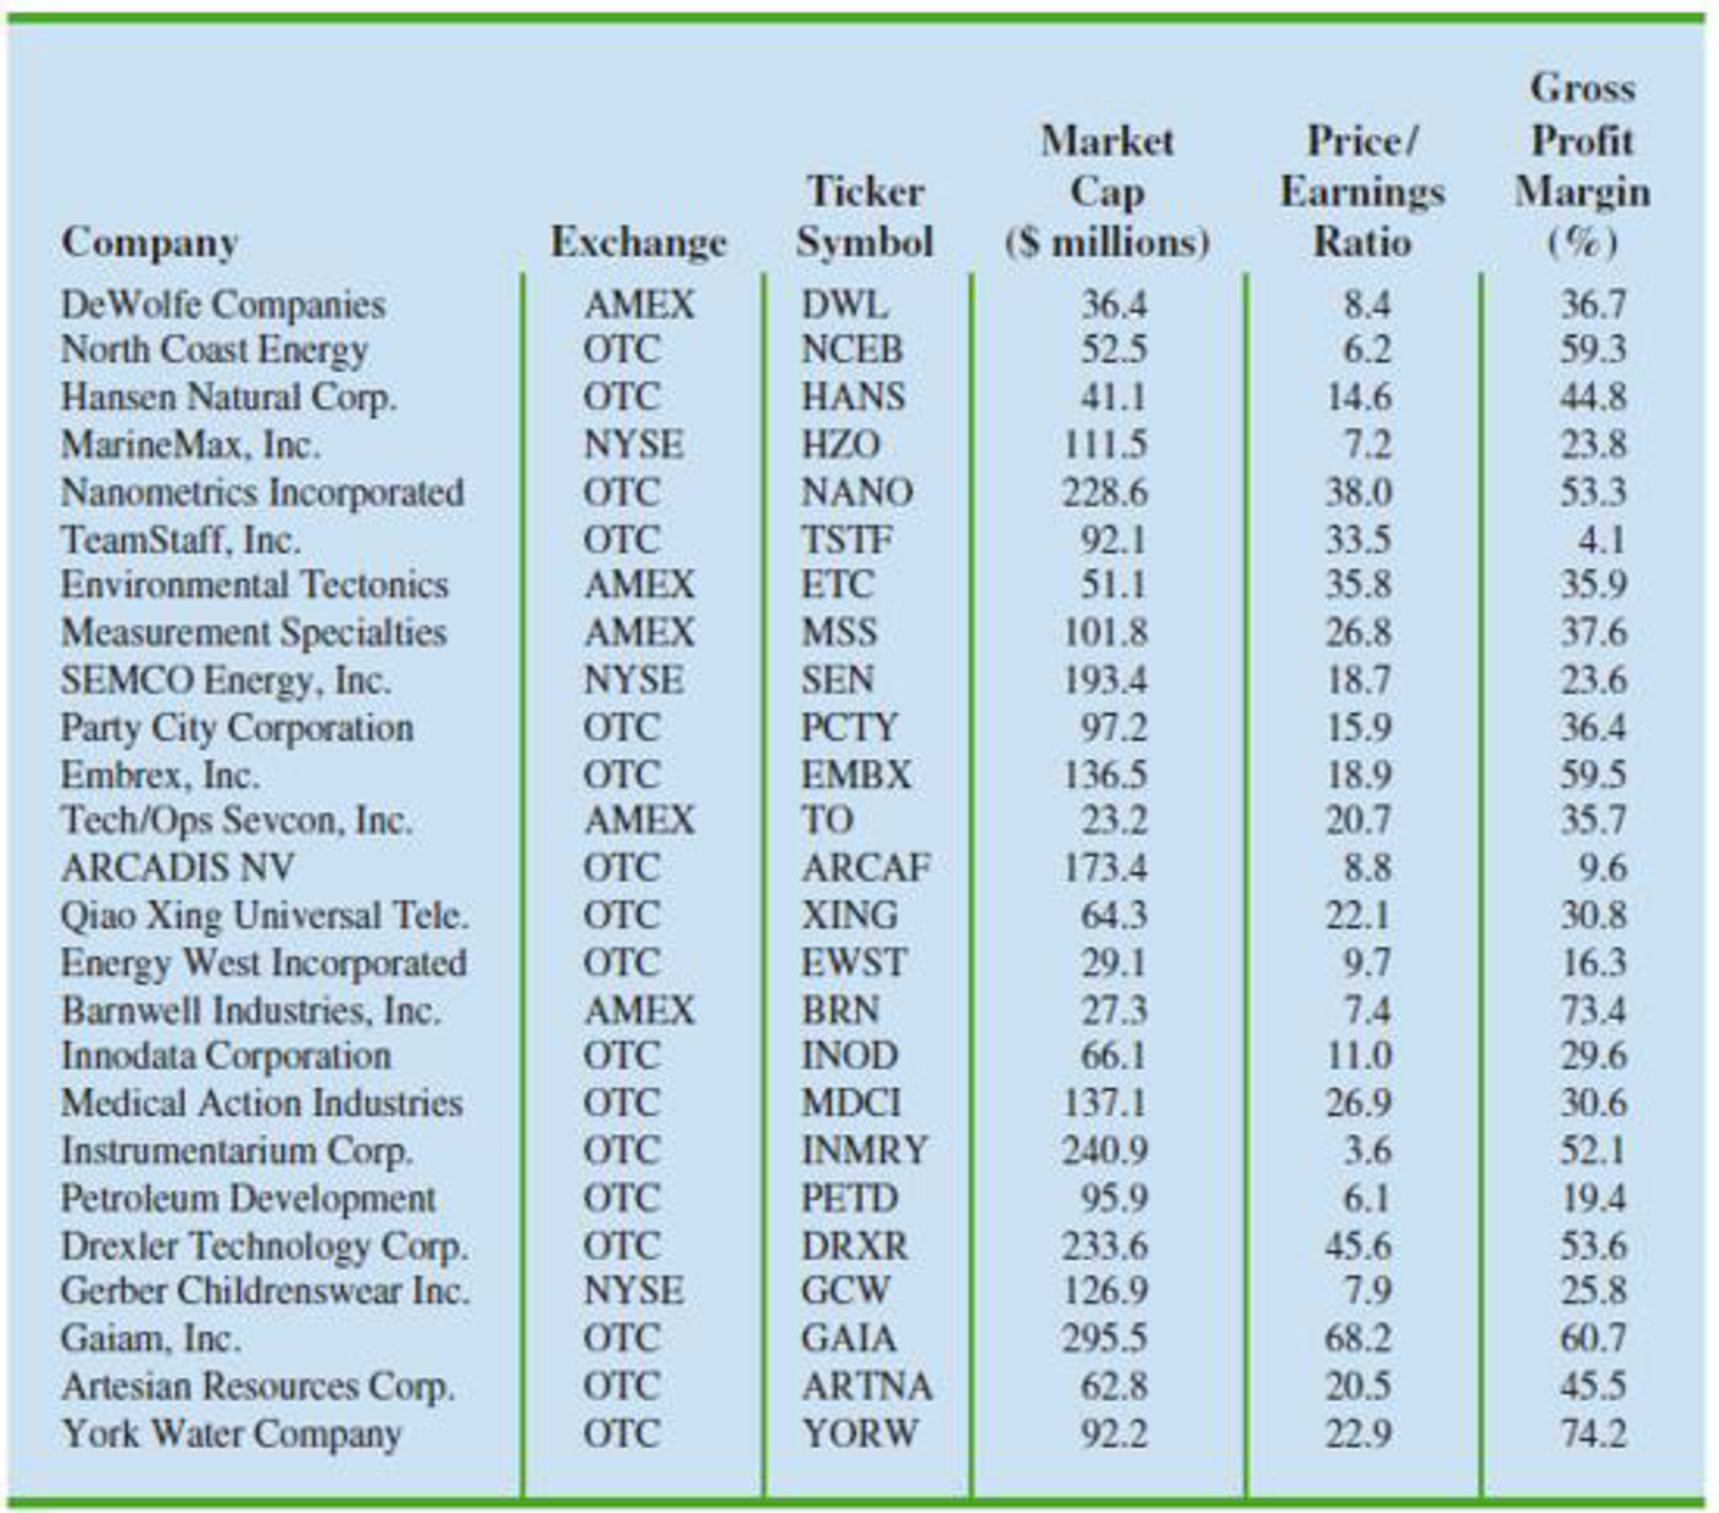
Table 1.8 shows a data set containing information for 25 of the shadow stocks tracked by the American Association of Individual Investors. Shadow stocks are common stocks of smaller companies that are not closely followed by Wall Street analysts. The data set is also on the website that accompanies the text in the DATA file named Shadow02.
TABLE 1.8 DATA SET FOR 25 SHADOW STOCKS
- a. How many variables are in the data set?
- b. Which of the variables are categorical and which are quantitative?
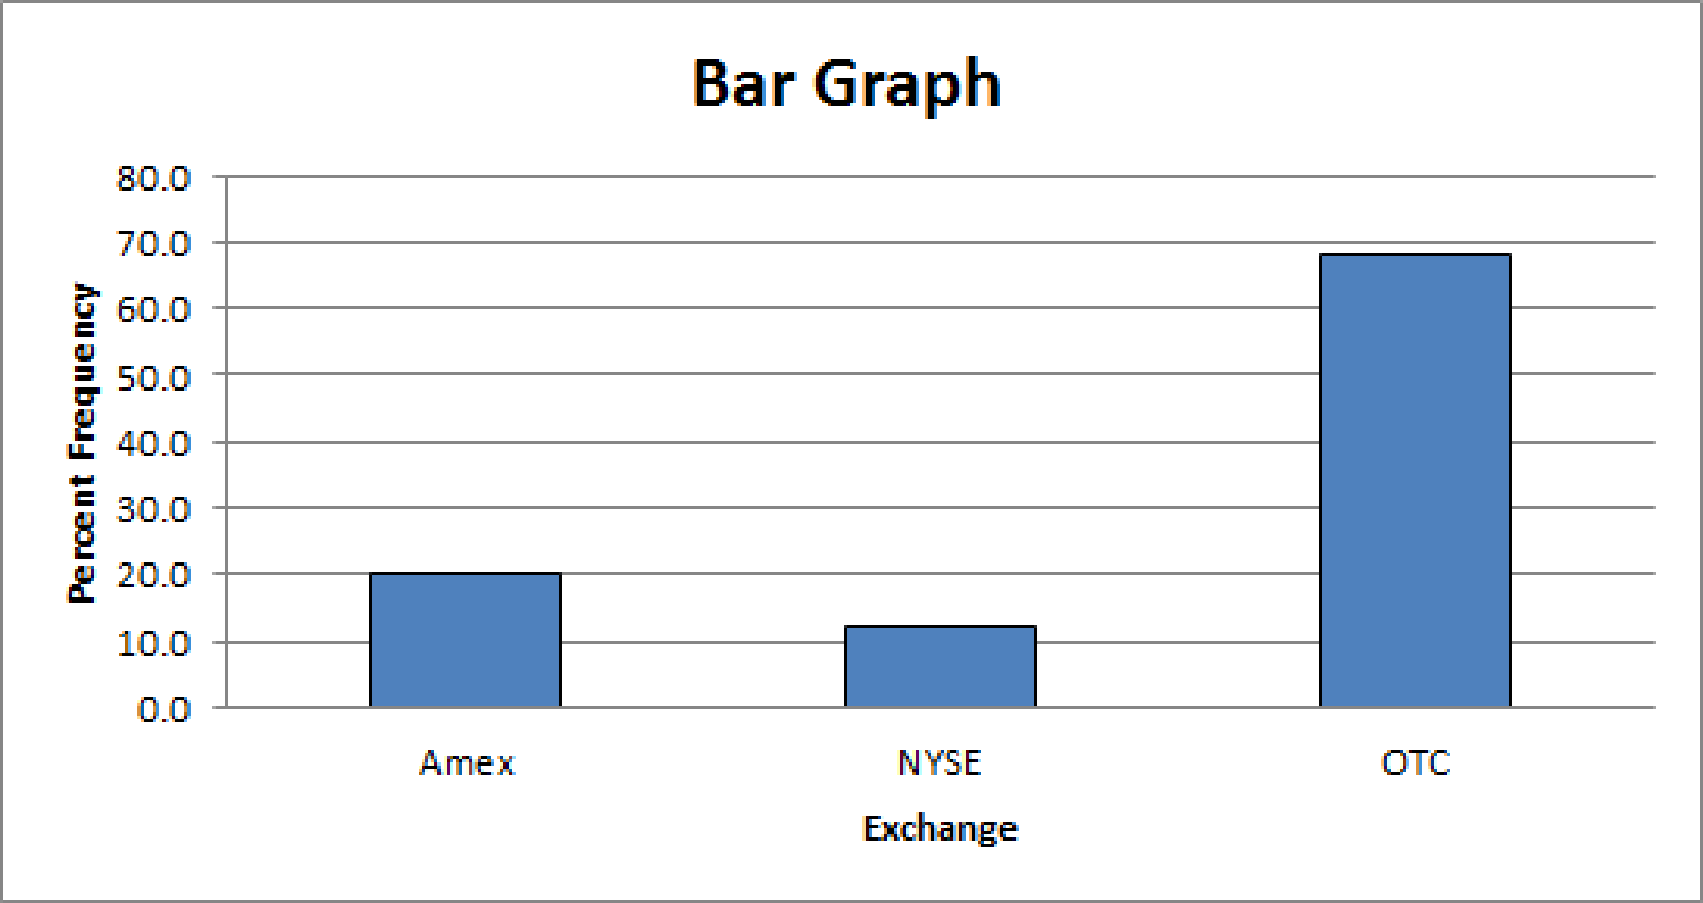
- c. For the Exchange variable, show the frequency and the percent frequency for AMEX, NYSE, and OTC. Construct a bar graph similar to Figure 1.4 for the Exchange variable.
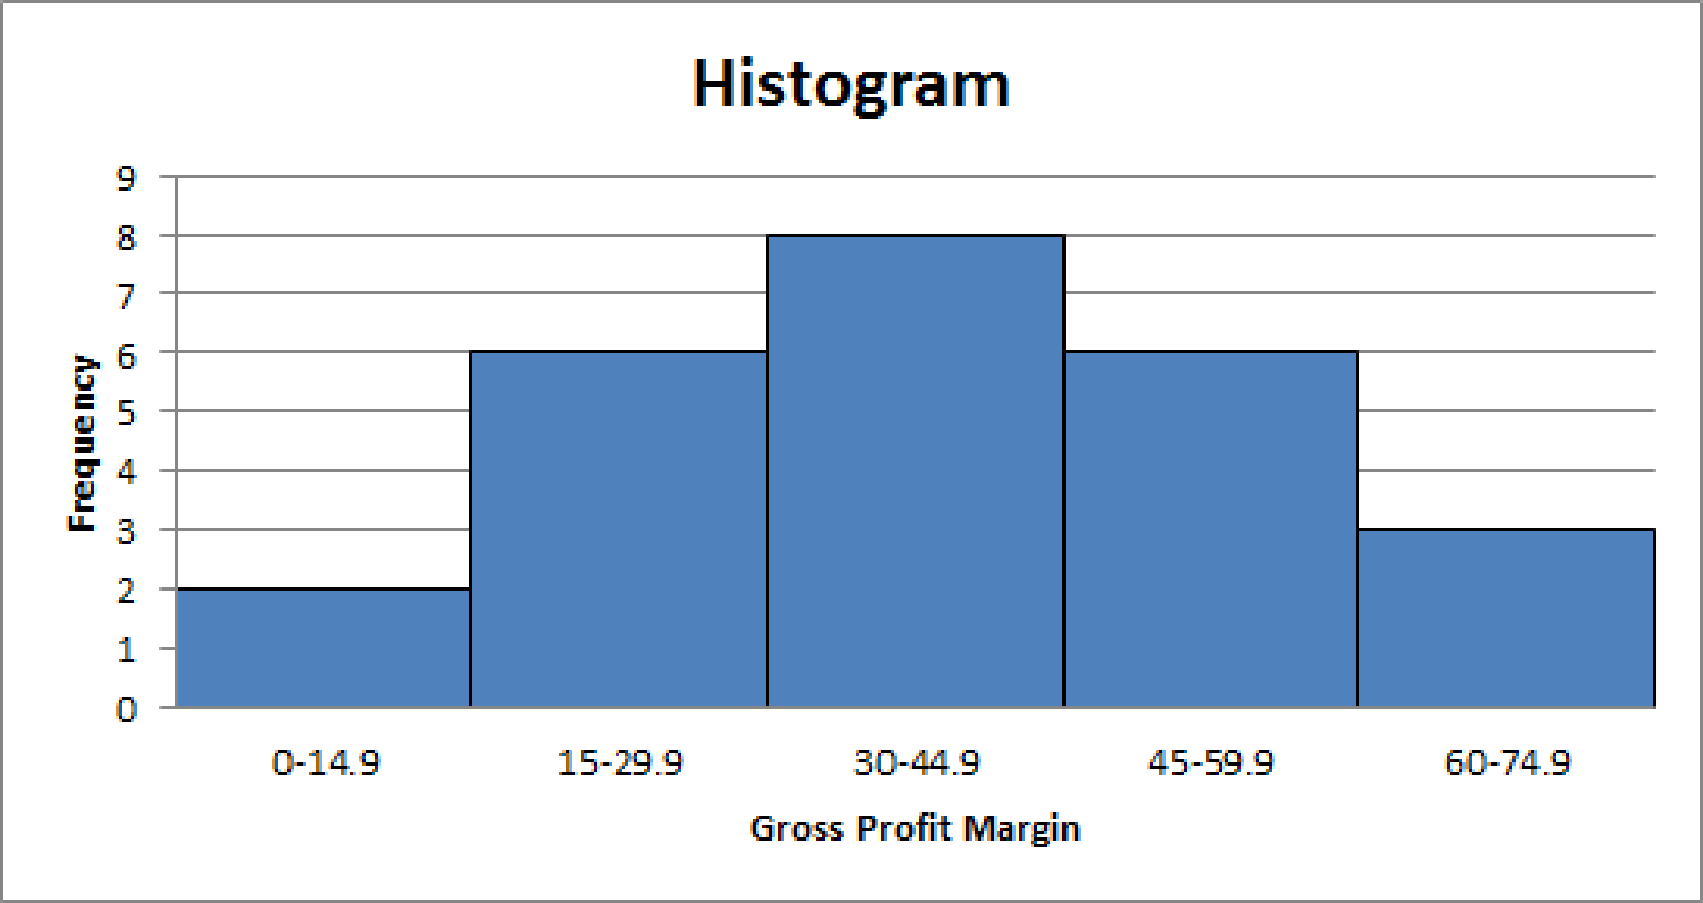
- d. Show the frequency distribution for the Gross Profit Margin using the five intervals: 0–14, 9, 15–29.9, 30–44.9, 45–59, 9, and 60–74, 9, Construct a histogram similar to Figure 1.5.
- e. What is the average price/earnings ratio?
a.
Find the number of variables.
Answer to Problem 25SE
There are five variables.
Explanation of Solution
The given information is about the companies, exchanges, ticker symbols, market capitals, price/earnings ratios and the gross profit margins of 25 shadow stocks.
Here, for the 25 shadow stocks, the exchange, ticker symbol, market cap, price/earnings ratio, and gross profit margin are recorded for analysis purposes. Therefore, these five are the variables under study.
Thus, there are five variables.
b.
Identify the categorical and quantitative variables.
Answer to Problem 25SE
Exchange and ticker symbol are categorical variables.
Market cap, price/earnings ratio, and gross profit margin are quantitative variables.
Explanation of Solution
The definitions of categorical and quantitative variables are given below.
Categorical variable:
Labels or names that are used to recognize the attributes of each element in a study are called categorical data. In other words, such data can be grouped under specific categories. Hence, a variable with categorical data is called a categorical variable.
Quantitative variable:
The data that take up numerical values, which can be measured or counted are called quantitative data. A variable with quantitative data is called quantitative variable.
The variable, exchange represents the names of the stocks, which categorize the stocks. The ticker symbols also classify the stocks. Thus, the variables exchange and ticker symbol are categorical variables.
The market cap values, price/earnings ratios and gross profit margin are represented in numerical values that are measured. Thus, the variables market cap, price/earnings ratio, and gross profit margin are quantitative variables.
c.
Find the frequencies and the percent frequencies for AMEX, NYSE, and OTC.
Construct a bar graph for the data.
Answer to Problem 25SE
The frequencies and the percent frequencies for AMEX, NYSE, and OTC are tabulated below:
| Exchange | Frequency | Percent Frequency |
| AMEX | 5 | 20% |
| NYSE | 3 | 12% |
| OTC | 17 | 68% |
The bar graph for the data is as follows:
Explanation of Solution
Calculation:
From the data set for the 25 shadow stocks, the frequency and the percentage of the frequency for AMEX, NYSE, and OTC are obtained as follows:
| Exchange | Tally | Frequency | Percent Frequency |
| AMEX | 5 | ||
| NYSE | 3 | ||
| OTC | 17 | ||
| Total | 25 | 100 |
Software Procedure:
Step-by-step procedure to draw the bar graph using EXCEL software:
- Open an EXCEL sheet.
- Enter the exchanges and the corresponding percent frequencies in columns A and B respectively, under the headings of Exchange in cell A1 and Percent Frequency in cell B1.
- Select the entered data along with the headings.
- Choose Insert > Column > 2-D Column > Clustered Column.
- Choose Layout > Chart Title > Above Chart and enter Bar Graph.
- Choose Layout > Axis Title > Primary Horizontal Axis Title > Title Below Axis and enter Exchange.
- Choose Layout > Axis Title > Primary Vertical Axis Title > Rotated Title and enter Percent Frequency.
Hence, the bar graph for the data is obtained using EXCEL software.
d.
Construct the frequency distribution for the gross profit margin.
Construct a histogram using the given intervals.
Answer to Problem 25SE
The frequency distribution for the gross profit margin is given below:
| Intervals | Frequency |
| 0–14.9 | 2 |
| 15–29.9 | 6 |
| 30–44.9 | 8 |
| 45–59.9 | 6 |
| 60–74.9 | 3 |
The histogram using the given intervals is as follows:
Explanation of Solution
Calculation:
The given intervals are 0–14.9, 15–29.9, 30–44.9, 45–59.9, and 60–74.9.
The frequency for each class is obtained, and the distribution for the gross profit margin is tabulated below:
| Intervals | Tally | Frequency |
| 0–14.9 | 2 | |
| 15–29.9 | 6 | |
| 30–44.9 | 8 | |
| 45–59.9 | 6 | |
| 60–74.9 | 3 |
Software Procedure:
Step-by-step procedure to draw the histogram using EXCEL software:
- Open an EXCEL sheet.
- Enter the intervals for the gross profit margins and the corresponding frequencies in columns A and B respectively, under the headings of Gross Profit Margin in cell A1 and Frequency in cell B1.
- Select the entered data along with the headings.
- Choose Insert > Column > 2-D Column > Clustered Column.
- Choose Layout > Chart Title > Above Chart and enter Histogram.
- Choose Layout > Axis Title > Primary Horizontal Axis Title > Title Below Axis and enter Gross Profit Margin.
- Choose Layout > Axis Title > Primary Vertical Axis Title > Rotated Title and enter Frequency.
- Double click on a bar and in Series Options, set the Gap Width to the minimum of No Gap or 0%.
Hence, the histogram for the gross profit margin is obtained using EXCEL software.
e.
Find the average price/earnings ratio.
Answer to Problem 25SE
The average price/earnings ratio is $ 20.2 million.
Explanation of Solution
Calculation:
The average price/earnings ratio can be obtained using software.
Software Procedure:
Step-by-step procedure to obtain the average using EXCEL software:
- Open an EXCEL sheet.
- Enter the data on price/earnings ratio in cells E3 to E27 in column E, under the heading of average Price/Earnings Ratio in cell E2.
- In cell C1, enter the formula =AVERAGE(E3:E27).
- Press Enter.
Output using the EXCEL software is given below:
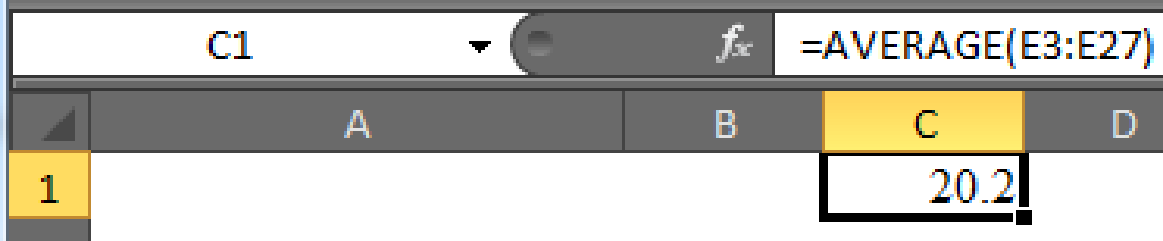
Hence, the average price/earnings ratio is $ 20.2 million.
Want to see more full solutions like this?
Chapter 1 Solutions
Modern Business Statistics with Microsoft Office Excel (with XLSTAT Education Edition Printed Access Card) (MindTap Course List)


 Glencoe Algebra 1, Student Edition, 9780079039897...AlgebraISBN:9780079039897Author:CarterPublisher:McGraw Hill