
Modern Business Statistics with Microsoft Office Excel (with XLSTAT Education Edition Printed Access Card) (MindTap Course List)
6th Edition
ISBN: 9781337115186
Author: David R. Anderson, Dennis J. Sweeney, Thomas A. Williams, Jeffrey D. Camm, James J. Cochran
Publisher: Cengage Learning
expand_more
expand_more
format_list_bulleted
Videos
Textbook Question
Chapter 1, Problem 14SE
The following data show the number of rental cars in service for three rental car companies: Hertz, Avis, and Dollar, over a four-year period.
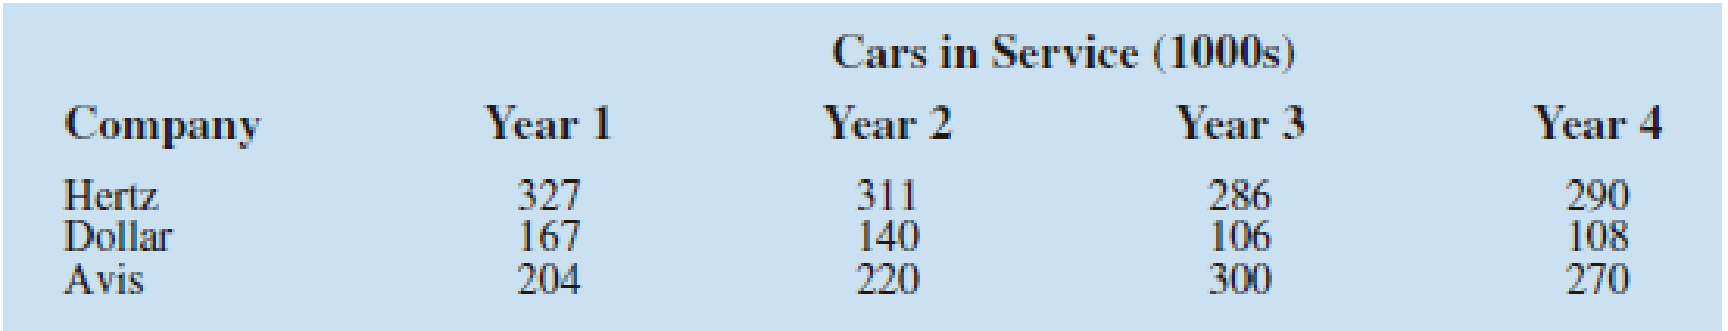
- Construct a time series graph for the years 1 to 4 showing the number of rental cars in service for each company. Show the time series for all three companies on the same graph.
- Comment on who appears to be the market share leader and how the market shares are changing over time.
- Construct a bar chart showing rental cars in service for Year 4. Is this chart based on cross-sectional or time series data?
Expert Solution & Answer

Trending nowThis is a popular solution!

Students have asked these similar questions
The following data show the number of rental cars in service for three rental car corporations: Henz, Avis and Dollar. The data are for the years 2007-2010 and are in thousands of vehicles (auto Rental News website, May 15, 2011)
Company
2007
2008
2009
2010
Hentz
327
311
286
290
Dollar
167
140
106
108
Avis
204
220
300
270
Construct a time series graph for years 2007 and 2010 showing the number of rental cars service for each company. Show the time series for all three companies on the same graph
Comment on who appears to be the market share leaders and how market shares are changing over time.
Construct a bar chart showing rental cars in service for 2010. Is this chart based on cross sectional or time series data?
The following chart shows student population in a certain elementary school over a 5 year period.
The following is a time series for the last 6 months of 2016
50 54 65 58 70 68
The three (3) months moving totals are:
Chapter 1 Solutions
Modern Business Statistics with Microsoft Office Excel (with XLSTAT Education Edition Printed Access Card) (MindTap Course List)
Ch. 1 - 1. Discuss the differences between statistics as...Ch. 1 - 2. Tablet PC Comparison provides a wide variety of...Ch. 1 - 3. Refer to Table 1.6.
What is the average cost...Ch. 1 - 4. Table 1.7 shows data for eight cordless...Ch. 1 - 5. Refer to the data set in Table 1.7.
What is the...Ch. 1 - 6. J.D. Power and Associates surveys new...Ch. 1 - 7. The Kroger Company is one of the largest...Ch. 1 - 8. The Tennessean, an online newspaper located in...Ch. 1 - 9. The Commerce Department reported receiving the...Ch. 1 - 10. The Bureau of Transportation Statistics...
Ch. 1 - 11. In a Gallup telephone survey conducted on...Ch. 1 - 12. The Hawaii Visitors Bureau collects data on...Ch. 1 - Figure 1.10 provides a bar chart showing the...Ch. 1 - The following data show the number of rental cars...Ch. 1 - The U.S. Census Bureau tracks sales per month for...Ch. 1 - 17. A manager of a large corporation recommends a...Ch. 1 - 18. A random telephone survey of 1021 adults (aged...Ch. 1 - 19. A Bloomberg Businessweek North American...Ch. 1 - 20. A survey of 131 investment managers in...Ch. 1 - 21. A seven-year medical research study reported...Ch. 1 - Prob. 22SECh. 1 - Pew Research Center is a nonpartisan polling...Ch. 1 - 24. A sample of midterm grades for five students...Ch. 1 -
Table 1.8 shows a data set containing information...
Knowledge Booster


Learn more about
Need a deep-dive on the concept behind this application? Look no further. Learn more about this topic, statistics and related others by exploring similar questions and additional content below.Similar questions
- Suppose the following table shows the approximate price of a certain stock in December of each year from 2005 through 2014, as well as the 4-year moving averages for 2005 through 2007.† Complete the table by computing the remaining 4-year moving averages. (Note the peak in 2007 and the drop in subsequent years.) Round each average to the nearest dollar. (Chart in picture)arrow_forwardthe values of alabama building contracts (in $ millions) for a 12-month period follow.240 350 230 260 280 320 220 310 240 310 240 230a. construct a time series plot. What type of pattern exists in the data?arrow_forwardThe following chart shows "living wage" jobs in Rochester per 1000 working age adults over a 5 year period. Year 1997 1998 1999 2000 2001 Jobs 630 680 715 745 770 What is the average rate of change in the number of living wage jobs from 1997 to 1999?--------- Jobs/YearWhat is the average rate of change in the number of living wage jobs from 1999 to 2001?---------- Jobs/Yeararrow_forward
- The following table gives the annual salary for the troupearrow_forwardThe managers of a brokerage firm are interested in finding out if the number of new clients a broker brings into the firm affects the sales generated by the broker. For the last year, the managers sampled 16 brokers and determined the number of new clients they enrolled during that year and their sales amounts in millions of dollars for that year. This data is presented in the table that follows. In your answers, sales should be left as a decimal as in the data table. It is not necessary to multiply by one million dollars. Perform a simple linear regression analysis of this data and answer the following questions. Suggestion: Read all of the questions before doing any analysis. Broker New Clients Sales 1 27 5.32 2 11 3.44 3 42 7.96 4 33 6.62 5 15 4.06 6 15 3.16 7 25 4.9 8 36 6.84 9 28 5.8 10 30 5.84 11 17 3.56 12 22 4.58 13 18 3.7 14 24 5.34 15 35 6.9…arrow_forwardThe managers of a brokerage firm are interested in finding out if the number of new clients a broker brings into the firm affects the sales generated by the broker. For the last year, the managers sampled 16 brokers and determined the number of new clients they enrolled during that year and their sales amounts in millions of dollars for that year. This data is presented in the table that follows. In your answers, sales should be left as a decimal as in the data table. It is not necessary to multiply by one million dollars. Perform a simple linear regression analysis of this data and answer the following questions. Suggestion: Read all of the questions before doing any analysis. Broker New Clients Sales 1 27 5.32 2 11 3.44 3 42 7.96 4 33 6.62 5 15 4.06 6 15 3.16 7 25 4.9 8 36 6.84 9 28 5.8 10 30 5.84 11 17 3.56 12 22 4.58 13 18 3.7 14 24 5.34 15 35 6.9…arrow_forward
- The managers of a brokerage firm are interested in finding out if the number of new clients a broker brings into the firm affects the sales generated by the broker. For the last year, the managers sampled 16 brokers and determined the number of new clients they enrolled during that year and their sales amounts in millions of dollars for that year. This data is presented in the table that follows. In your answers, sales should be left as a decimal as in the data table. It is not necessary to multiply by one million dollars. Perform a simple linear regression analysis of this data and answer the following questions. Suggestion: Read all of the questions before doing any analysis. Broker New Clients Sales 1 27 5.32 2 11 3.44 3 42 7.96 4 33 6.62 5 15 4.06 6 15 3.16 7 25 4.9 8 36 6.84 9 28 5.8 10 30 5.84 11 17 3.56 12 22 4.58 13 18 3.7 14 24 5.34 15 35 6.9…arrow_forwardThe managers of a brokerage firm are interested in finding out if the number of new clients a broker brings into the firm affects the sales generated by the broker. For the last year, the managers sampled 16 brokers and determined the number of new clients they enrolled during that year and their sales amounts in millions of dollars for that year. This data is presented in the table that follows. In your answers, sales should be left as a decimal as in the data table. It is not necessary to multiply by one million dollars. Perform a simple linear regression analysis of this data and answer the following questions. Suggestion: Read all of the questions before doing any analysis. Broker New Clients Sales 1 27 5.32 2 11 3.44 3 42 7.96 4 33 6.62 5 15 4.06 6 15 3.16 7 25 4.9 8 36 6.84 9 28 5.8 10 30 5.84 11 17 3.56 12 22 4.58 13 18 3.7 14 24 5.34 15 35 6.9…arrow_forwardFor the hawkins company, the monthly percentages of all shipments received on timeover the past 12 months are 80, 82, 84, 83, 83, 84, 85, 84, 82, 83, 84, and 83.a. construct a time series plot. What type of pattern exists in the data?arrow_forward
- The folloiwing table shows data for U.S. movie theater admissions (per week). Display the data as a time-series graph and write a short paragraph explaining any noticeable trends or patterns. Year Admissions Year Admissions 1945 79.0 1985 20.30 1955 39.9 1995 23.3 1965 19.8 2005 26.5 1975 19.9 2015 25.4arrow_forwardFind the total year costs for 5 years, 10 years, and 15 years for purchasing and renting a house. Then compare your answers to those in the following table. Length of Time Purchase Home Rent Home 5 years $78,559.20 $54,900.00 10 years $127,118.40 $115,200.00 15 years $175,677.60 $180,900.00 Purchase Home Total 5-year cost: $30,000.00+5×12×$809.32=$78,559.20 Total 10-year cost: $30,000.00+10×12×$809.32=$127,118.40 Total 15-year cost: $30,000.00+15×12×$809.32=$175,677.60 Rent Home Total 5-year cost: (4×12×$900)+(1×12×$975)=$54,900 Total 10-year cost: (4×12×$900)+(4×12×$975)+(2×12×$1050)=$115,200 Total 15-year cost: (4×12×$900)+(4×12×$975)+(4×12×$1050)+(3×12×$1125)=$180,1900 Recall the pros and cons of buying a house and which conditions make it better to to purchase a home. Also, think about the pros and cons of renting a house and which conditions make it better to rent. Use this information along with the total costs you found to answer the following prompts. Make…arrow_forwardThe creator of a new online multiplayer survival game has been tracking the monthly downloads of the game. The following table shows the monthly downloads (in thousands) for each month of the current and previous year. Click on the datafile logo to reference the data. Month Downloads Month Downloads (previous year) (thousands) (current year) (thousands) February 33.0 January 37.0 March 34.0 February 35.0 April 34.0 March 37.0 May 32.0 April 38.0 June 32.0 May 35.0 July 35.0 June 36.0 August 35.0 July 35.0 September 37.0 August 35.0 October 37.0 September 34.0 November 36.0 October 31.0 December 34.0 Compute the mean, median, and mode for number of downloads in the previous year. Mean (to 3 decimals) thousand Median (to 2 decimal) thousand Mode (to 2 decimal) thousand…arrow_forward
arrow_back_ios
SEE MORE QUESTIONS
arrow_forward_ios
Recommended textbooks for you
 MATLAB: An Introduction with ApplicationsStatisticsISBN:9781119256830Author:Amos GilatPublisher:John Wiley & Sons Inc
 Probability and Statistics for Engineering and th...StatisticsISBN:9781305251809Author:Jay L. DevorePublisher:Cengage Learning
 Statistics for The Behavioral Sciences (MindTap C...StatisticsISBN:9781305504912Author:Frederick J Gravetter, Larry B. WallnauPublisher:Cengage Learning
 Elementary Statistics: Picturing the World (7th E...StatisticsISBN:9780134683416Author:Ron Larson, Betsy FarberPublisher:PEARSON
 The Basic Practice of StatisticsStatisticsISBN:9781319042578Author:David S. Moore, William I. Notz, Michael A. FlignerPublisher:W. H. Freeman
 Introduction to the Practice of StatisticsStatisticsISBN:9781319013387Author:David S. Moore, George P. McCabe, Bruce A. CraigPublisher:W. H. Freeman
MATLAB: An Introduction with Applications
Statistics
ISBN:9781119256830
Author:Amos Gilat
Publisher:John Wiley & Sons Inc
Probability and Statistics for Engineering and th...
Statistics
ISBN:9781305251809
Author:Jay L. Devore
Publisher:Cengage Learning
Statistics for The Behavioral Sciences (MindTap C...
Statistics
ISBN:9781305504912
Author:Frederick J Gravetter, Larry B. Wallnau
Publisher:Cengage Learning
Elementary Statistics: Picturing the World (7th E...
Statistics
ISBN:9780134683416
Author:Ron Larson, Betsy Farber
Publisher:PEARSON
The Basic Practice of Statistics
Statistics
ISBN:9781319042578
Author:David S. Moore, William I. Notz, Michael A. Fligner
Publisher:W. H. Freeman
Introduction to the Practice of Statistics
Statistics
ISBN:9781319013387
Author:David S. Moore, George P. McCabe, Bruce A. Craig
Publisher:W. H. Freeman
Finite Math: Markov Chain Example - The Gambler's Ruin; Author: Brandon Foltz;https://www.youtube.com/watch?v=afIhgiHVnj0;License: Standard YouTube License, CC-BY
Introduction: MARKOV PROCESS And MARKOV CHAINS // Short Lecture // Linear Algebra; Author: AfterMath;https://www.youtube.com/watch?v=qK-PUTuUSpw;License: Standard Youtube License
Stochastic process and Markov Chain Model | Transition Probability Matrix (TPM); Author: Dr. Harish Garg;https://www.youtube.com/watch?v=sb4jo4P4ZLI;License: Standard YouTube License, CC-BY