Concept explainers
Videos
(a)
To calculate: the value of
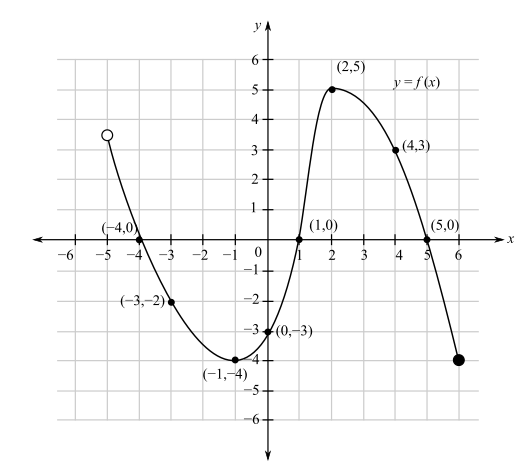
(b)
thedomain of the function from the graphgiven below:
(c)
The range of the function from the graphgiven below:
(d)
the interval in which the function
(e)
the interval in which the function
(f)
The number for which
(g)
thenumber for which
(h)
the x-intercepts of the function from the graph shown below:
(i)
the y-intercept(s) of the function from the graph shown below:
Want to see the full answer?
Check out a sample textbook solution
Chapter 1 Solutions
Learning Guide for Precalculus Plus NEW MyMathLab with Pearson eText - Access Card Package


- Finding a Minimum Suppose the function f=x392x2+6x+1 describes a physical situation that makes sense only for whole numbers between 1 and 5. For what value of x does f reach a minimum and what is that minimum value?arrow_forwardSales Growth In this exercise, we develop a model for the growth rate G, in thousands of dollars per year, in sales of the product as a function of the sales level s, in thousands of dollars. The model assumes that there is a limit to the total amount of sales that can be attained. In this situation, we use the term unattained sales for difference this limit and the current sales level. For example, if we expect sales grow to 3 thousand dollars in the long run, then 3-s is the unattained sales. The model states that the growth rate G is proportional to the product of the sales level s, and the unattained sales. Assume that the constant of proportionality is 0.3 and that the sales grow to 2 thousand dollars in the long run. a.Find the formula for unattained sales. b.Write an equation that shows the proportionality relation for G. c.On the basis of the equation from the part b, make a graph of G as a function of s. d.At what sales level is the growth rate as large as possible? e.What is the largest possible growth rate?arrow_forwardA triangle is formed by the coordinate axes and a line through the point (2,1), as shown in the figure. The value of y is given by y=1+2x2 Write the area A of the triangle as a function of x. Determine the domain of the function in the context of the problem. Sketch the graph of the area function. Estimate the minimum area of the triangle from the graph.arrow_forward
- Minimizing a Distance When we seek a minimum or maximum value of a function, it is sometimes easier to work with a simpler function instead. Suppose g(x)=f(x) where f(x)0 for all x. Explain why the local minima and maxima of f and g occur at the same values of x. Let gx be the distance between the point 3,0 and the point (x,x2) on the graph of the parabola y=x2. Express g as a function of x. Find the minimum value of the function g that you found in part b. Use the principle described in part a to simplify your work.arrow_forwardMinimum Find the minimum value of x2+20/(x+1) on the horizontal span of 0 to 10.arrow_forwardGrazing Kangaroos The amount of vegetation eaten in a day by a grazing animal V of food available measured as biomass, in units such as pounds per acre. This relationship is called the functional response. If there is little vegetation available, the daily intake will be small, since the animal will have difficulty finding and eating the food. As the amount of food biomass increases, so does the daily intake. Clearly, though, there is a limit to the amount the animal will eat, regardless of the amount of food available. This maximum amount eaten is the satiation level. a.For the western grey kangaroo of Australia, the functional response is G=2.54.8e0.004V, where G=G(V) is the daily intake measured in pounds and V is the vegetation biomass measured in pounds per acre. i. Draw a graph of G against V. Include vegetation biomass levels up to 2000 pounds per acre. ii. Is the graph you found in part i concave up or concave down? Explain in practical terms what your answer means about how this kangaroo feeds. iii. There is a minimal vegetation biomass level below which the western grey kangaroo will eat nothing. Another way of expressing this is to say that the animal cannot reduce the food biomass below this level. Find this minimal level. iv. Find the satiation level for the western grey kangaroo. b. For the red kangaroo of Australia, the functional response is R=1.91.9e0.033V, Where R is the daily intake measured in pounds and V is the vegetation biomass measured in pounds per acre. i. Add the graph of R against V to the graph of G you drew in part a. ii. A simple measure of the grazing efficiency of an animal involves the minimal vegetation biomass level described above: The lower the minimal level for an animal, the more efficient it is at grazing. Which is more efficient at grazing, the western grey kangaroo or the red kangaroo?arrow_forward
 Glencoe Algebra 1, Student Edition, 9780079039897...AlgebraISBN:9780079039897Author:CarterPublisher:McGraw Hill
 Functions and Change: A Modeling Approach to Coll...AlgebraISBN:9781337111348Author:Bruce Crauder, Benny Evans, Alan NoellPublisher:Cengage Learning
 Algebra & Trigonometry with Analytic GeometryAlgebraISBN:9781133382119Author:SwokowskiPublisher:Cengage
 College AlgebraAlgebraISBN:9781305115545Author:James Stewart, Lothar Redlin, Saleem WatsonPublisher:Cengage Learning
 Algebra and Trigonometry (MindTap Course List)AlgebraISBN:9781305071742Author:James Stewart, Lothar Redlin, Saleem WatsonPublisher:Cengage Learning