
Bundle: Introduction to Statistics and Data Analysis, 5th + WebAssign Printed Access Card: Peck/Olsen/Devore. 5th Edition, Single-Term
5th Edition
ISBN: 9781305620711
Author: Roxy Peck, Chris Olsen, Jay L. Devore
Publisher: Cengage Learning
expand_more
expand_more
format_list_bulleted
Concept explainers
Videos
Textbook Question
Chapter 1, Problem 37CR
Many adolescent boys aspire to be professional athletes. The paper “Why Adolescent Boys Dream of Becoming Professional Athletes” (Psychological Reports [1999]:1075–1085) examined some of the reasons. Each boy in a sample of teenage boys was asked the following question: “Previous studies have shown that more teenage boys say that they are considering becoming professional athletes than any other occupation. In your opinion, why do these boys want to become professional athletes?” The resulting data are shown in the following table:
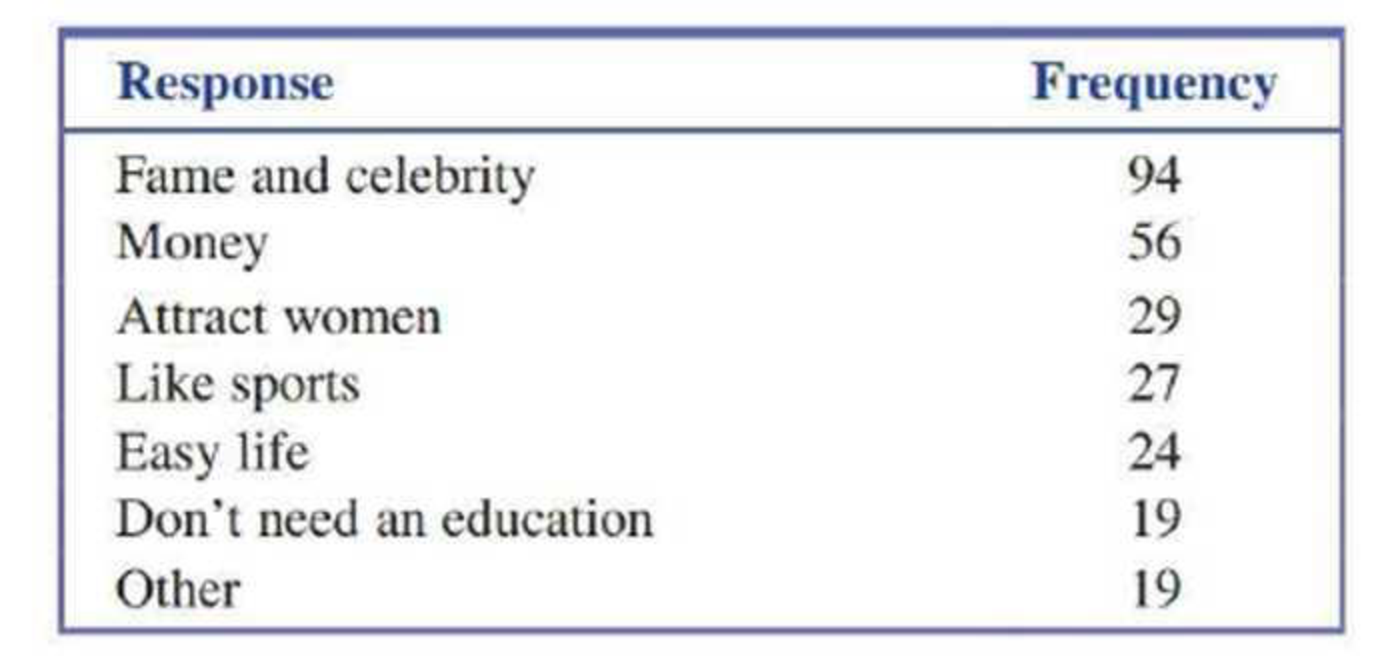
Construct a bar chart to display these data.
Expert Solution & Answer
Want to see the full answer?
Check out a sample textbook solution
Chapter 1 Solutions
Bundle: Introduction to Statistics and Data Analysis, 5th + WebAssign Printed Access Card: Peck/Olsen/Devore. 5th Edition, Single-Term
Ch. 1.3 - Give brief definitions of the terms descriptive...Ch. 1.3 - Give brief definitions of the terms population and...Ch. 1.3 - The following conclusion from a study appeared in...Ch. 1.3 - Based on a study of 2 121 children between the...Ch. 1.3 - The student senate at a university with 15,000...Ch. 1.3 - Prob. 6ECh. 1.3 - The supervisors of a rural county are interested...Ch. 1.3 - A consumer group conducts crash tests of new model...Ch. 1.3 - A building contractor has a chance to buy an odd...Ch. 1.3 - The article Brain Shunt Tested to Treat Alzheimers...
Ch. 1.3 - In a study of whether taking a garlic supplement...Ch. 1.4 - Classify each of the following variables as either...Ch. 1.4 - Classify each of the following variables as either...Ch. 1.4 - Prob. 14ECh. 1.4 - For the following numerical variables, state...Ch. 1.4 - For each of the following situations, give a set...Ch. 1.4 - In a survey of 100 people who had recently...Ch. 1.4 - Prob. 18ECh. 1.4 - The article Feasting on Protein (AARP Bulletin,...Ch. 1.4 - ● Box Office Mojo (www.boxofficcmojo.com) tracks...Ch. 1.4 - Prob. 21ECh. 1.4 - The following display is a graph similar to one...Ch. 1.4 - Prob. 23ECh. 1.4 - Prob. 24ECh. 1.4 - Prob. 25ECh. 1.4 - Prob. 26ECh. 1.4 - The article Fliers Trapped on Tarmac Push for...Ch. 1.4 - Prob. 28ECh. 1.4 - The article Where College Students Buy Textbooks...Ch. 1.4 - Prob. 30ECh. 1.4 - Prob. 31ECh. 1 - The report Testing the Waters 2009 (nrdc.org)...Ch. 1 - The U.S. Department of Education reported that 14%...Ch. 1 - The Computer Assisted Assessment Center at the...Ch. 1 - The article Just How Safe Is That Jet? (USA TODAY,...Ch. 1 - Each year, U.S. News and World Report publishes a...Ch. 1 - Many adolescent boys aspire to be professional...
Knowledge Booster


Learn more about
Need a deep-dive on the concept behind this application? Look no further. Learn more about this topic, statistics and related others by exploring similar questions and additional content below.Similar questions
- What is meant by the sample space of an experiment?arrow_forwardWhat is an experiment?arrow_forwardUrban Travel Times Population of cities and driving times are related, as shown in the accompanying table, which shows the 1960 population N, in thousands, for several cities, together with the average time T, in minutes, sent by residents driving to work. City Population N Driving time T Los Angeles 6489 16.8 Pittsburgh 1804 12.6 Washington 1808 14.3 Hutchinson 38 6.1 Nashville 347 10.8 Tallahassee 48 7.3 An analysis of these data, along with data from 17 other cities in the United States and Canada, led to a power model of average driving time as a function of population. a Construct a power model of driving time in minutes as a function of population measured in thousands b Is average driving time in Pittsburgh more or less than would be expected from its population? c If you wish to move to a smaller city to reduce your average driving time to work by 25, how much smaller should the city be?arrow_forward
arrow_back_ios
arrow_forward_ios
Recommended textbooks for you
 Functions and Change: A Modeling Approach to Coll...AlgebraISBN:9781337111348Author:Bruce Crauder, Benny Evans, Alan NoellPublisher:Cengage Learning
 Glencoe Algebra 1, Student Edition, 9780079039897...AlgebraISBN:9780079039897Author:CarterPublisher:McGraw Hill
 Holt Mcdougal Larson Pre-algebra: Student Edition...AlgebraISBN:9780547587776Author:HOLT MCDOUGALPublisher:HOLT MCDOUGAL
 Big Ideas Math A Bridge To Success Algebra 1: Stu...AlgebraISBN:9781680331141Author:HOUGHTON MIFFLIN HARCOURTPublisher:Houghton Mifflin Harcourt
 College Algebra (MindTap Course List)AlgebraISBN:9781305652231Author:R. David Gustafson, Jeff HughesPublisher:Cengage Learning
Functions and Change: A Modeling Approach to Coll...
Algebra
ISBN:9781337111348
Author:Bruce Crauder, Benny Evans, Alan Noell
Publisher:Cengage Learning
Glencoe Algebra 1, Student Edition, 9780079039897...
Algebra
ISBN:9780079039897
Author:Carter
Publisher:McGraw Hill
Holt Mcdougal Larson Pre-algebra: Student Edition...
Algebra
ISBN:9780547587776
Author:HOLT MCDOUGAL
Publisher:HOLT MCDOUGAL
Big Ideas Math A Bridge To Success Algebra 1: Stu...
Algebra
ISBN:9781680331141
Author:HOUGHTON MIFFLIN HARCOURT
Publisher:Houghton Mifflin Harcourt
College Algebra (MindTap Course List)
Algebra
ISBN:9781305652231
Author:R. David Gustafson, Jeff Hughes
Publisher:Cengage Learning
Sampling Methods and Bias with Surveys: Crash Course Statistics #10; Author: CrashCourse;https://www.youtube.com/watch?v=Rf-fIpB4D50;License: Standard YouTube License, CC-BY
Statistics: Sampling Methods; Author: Mathispower4u;https://www.youtube.com/watch?v=s6ApdTvgvOs;License: Standard YouTube License, CC-BY