
Sub part (a):
The possible combination of consumption of two goods.
Sub part (a):
Explanation of Solution
The consumption bundle of two goods can be calculated by using the following formula.
Substitute the respective values in equation (1) to calculate the number of peanut bags purchased while consuming 0 units of candy bars.
When the person consumes 0 quantities of candy bars, then he can purchase 10 units of peanut bags.
Table -1 shows the possible quantity of candy bars and peanut bags with the given level of income that is obtained by using equation (1).
Table -1
| Goods/Combination | 1 | 2 | 3 | 4 | 5 | 6 |
| Candy bars | 0 | 4 | 8 | 12 | 16 | 20 |
| Bags of peanuts | 10 | 8 | 6 | 4 | 2 | 0 |
Concept introduction:
Budget constraint: Budget constraints define the possible bundles of services and commodities that are purchased at a given price level with the entire income.
Sub part b:
The possible combination of consumption of two goods.
Sub part b:
Explanation of Solution
The diagram below shows the possible combination of two goods that can be purchased with the limited income. It is drawn based on the values given in the Table -1.
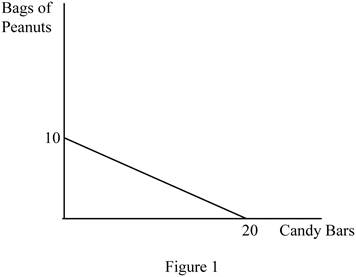
In Figure 1, the horizontal axis measures the quantity of candy bars and the vertical axis measures the quantity of peanut bags. The downward slope indicates the budget line.
The slope can be calculated as follows.
Thus, the slope of this budget line is -0.5.
Opportunity cost (OP) of obtaining one more candy bar can be calculated as follows.
In the calculation of opportunity cost, the sign can be ignored. Thus, the opportunity cost of getting one more candy bar is 0.5.
The opportunity cost (OP) of obtaining one more peanut bag can be calculated as follows.
In the calculation of opportunity cost, the sign can be ignored. The opportunity cost of getting one more candy bar is 2. The opportunity costs are constant over the possible combination of bundles since the slope of the budget line remains the same over different points in the budget line.
Concept introduction:
Budget constraint: Budget constraints define the possible bundles of services and commodities that are purchased at a given price level with the entire income.
Opportunity cost: Opportunity cost refers to the benefits given up in the process of obtaining some other benefit.
Sub part (c):
The possible combination of consumption of two goods.
Sub part (c):
Explanation of Solution
The budget line shows only the possible combination of goods and services that can be purchased simultaneously within the given income level. Thus, it does not determine the optimum quantity of two goods.
Concept introduction:
Budget constraint: Budget constraints define the possible bundles of services and commodities that are purchased at a given price level with the entire income.
Opportunity cost: Opportunity cost refers to the benefits given up in the process of obtaining some other benefit.
Sub part (d):
The possible combination of consumption of two goods.
Sub part (d):
Explanation of Solution
Table -2 shows the possible quantity of candy bars and peanut bags with the increased level of income that is obtained by using equation (1).
Table -2
| Goods/ Combination | 1 | 2 |
| Candy bars | 0 | 40 |
| Bags of peanuts | 20 | 0 |
The diagram below shows the possible combination of two goods that can be purchased with a limited income. It is drawn based on the values given in Table -2.
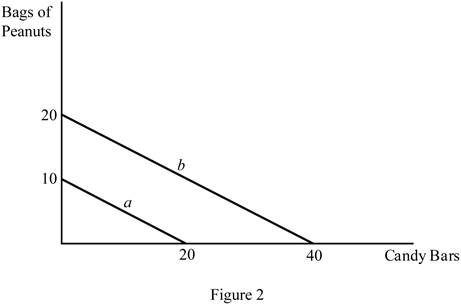
In Figure 2, the horizontal axis measures the quantity of the candy bar and the vertical axis measures the peanut bags. The downward slope (a) indicates the budget line with a $15 income, and the downward slope (b) indicates the budget line with a $30 income. Increasing the level of the income shifts the budget line to the right side.
Concept introduction:
Budget constraint: Budget constraints define the possible bundles of services and commodities that are purchased at a given price level with the entire income.
Opportunity cost: Opportunity cost refers to the benefits given up in the process of obtaining some other benefit.
Want to see more full solutions like this?
Chapter 1 Solutions
ECONOMICS W/CONNECT+20 >C<

- Title Suppose that Lynn enjoys coconut oil in her coffee. She has very particular preferences, and she mus Description Suppose that Lynn enjoys coconut oil in her coffee. She has very particular preferences, and she must have exactly two spoonfuls of coconut oil for each cup of coffee. Let C be the number of cups of coffee, and O be the number of spoonfuls of coconut oil. Also, let PC be the price of a cup of coffee. Suppose Lynn has $12 to spend on coffee and coconut oil. Also, the price of coconut oil is $.50 per spoonful.a) Graph Lynnâs Price Consumption Curve for prices, PC = $1, PC = $2, and PC = $3. Please put the number of cups of coffee on the horizontal axis, and the number of spoonfuls of coconut oil on the vertical axis. Be sure to label your graph carefully and accurately.b) Graph Lynnâs demand curve for coffee. You may assume that both coconut oil and coffee are continuous variables so she can consume any amount of coffee and coconut oil that she could afford.…arrow_forwardIf the price of an apple is $.50, the marginal utility per dollar spent for the fifth apple is Number of Apples Total Utility 130 180 220 A C E 2 3 4 LO 5 Noi 6 7 40 20 60 250 270 280 morfw escleris con B D 100 30 Larrow_forwardSuppose Duncan budgets $20 a week for entertainment. He can either go bowling for $4 a game, or play mini golf for $6 a game. Duncan maximizes his total utility by bowling twice and playing two games of mini golf. If the marginal utility from his second game of mini golf equals 12, what is the marginal utility per dollar from his second game of bowling? O 2 4-arrow_forward
- O O O A. 33 B. 56 C. 29 O D. 35 Units 1 2 E. 59 345W N 6 7 Marginal Utility 10 0053 O 8 Toffee (bars) 1 Total Utility 10 18 23 26 27 27 27 Refer to the table above. If this consumer purchases 3 toffee bars and 5 bags of cashews per week, his/her total utility will be Cashews (bags) Marginal Utility 12 10 7 5 2 1 0 Total Utility 12 22 29 34 36 37 27arrow_forward= Suppose that consumer has the following utility function: U(X,Y) = 2XY+20X. Suppose also that Px 10, Py = 20 and I = 80. What would be the optimal consumption of X and Y at the equilibrium, respectively? O O O 8,0 6, 1 0,4 4, 2arrow_forward0 2 O 4 6 08 D Scones 10 1 2 3 4 5 Total Utility 10 18 24 Refer to Table 6.3, which shows the total utility and marginal utility derived from the consumption of scones. The first column of the table represents the number of scones a consumer consumes in a day. The second column of the table presents the total utility derived from that consumption, and the third column shows the marginal utility of each additional scone. The total utility derived from the consumption of one scone is units. 28 30 Marginal Utility 6 2arrow_forward
- Suppose that the following Cobb-Douglas utility function is given U(X,Y) = X³y/2, Which of the following is correct? O Law of diminishing Marginal Utility holds for good Y but not for good X while Law of Diminishing Marginal Rate of Substitution holds. Law of diminishing Marginal Utility holds for good X but not for good Y while Law of Diminishing Marginal Rate of Substitution holds. Law of diminishing Marginal Utility holds for good Y but not for good X while Law of Diminishing Marginal Rate of Substitution fails to hold. Law of diminishing Marginal Utility holds for both goods and Law of Diminishing Marginal Rate of Substitution holds as wellarrow_forward32/ Assume that a consumer has a given budget or income of $24 and that she can buy only two goods, apples or bananas. The price of an apple is $3.00 and the price of a banana is $2.00. What is the slope of the budget line if the quantity of apples were measured on the horizontal axis and bananas on the vertical axis?arrow_forwardTable 6.1 Pretzels Marginal Utility 1 30 20 3 5 4 Refer to Table 6.1, which shows the marginal utility of each additional unit of pretzel for a consumer. The first column of the table shows the number of pretzels consumed in a day, and the second column of the table shows the marginal utility of each additional unit of pretzel. The total utility derived from the consumption of three pretzels is units. O a. 5 O b. 55 Oc. 15 Od. 57 O e. 70arrow_forward
- Answer the question on the basis of the following two schedules, which show the amounts of additional satisfaction (marginal utility) that a consumer would get from successive quantities MUS 56 48 32 24 20 16 Units of J 1 2 3 4 5 6 7 Multiple Choice O O What level of total utility is realized from the equilibrium combination of J and K, if the consumer has a money income of $36 and the prices of J and K are $4 and $4, respectively? O 12 238 utis 40 utils 204 Units of K 1 2 3 4 5 6 7 MUK 32 28 24 20 12 10. 8arrow_forwardWhat happens to the budget line if the government applies a specific tax of $1 per gallon of gasoline but does not tax other goods (assuming that the consumer will still buy more than 10 gallons per week)? What happens to the budget line if the tax applies only to purchases of gasoline in excess of 10 gallons per week? 1.) Use the line drawing tool to draw new budget constraint with the gasoline tax on all gallons of gasoline. Label this line 'L²₁ 2.) Use the multipoint curve drawing tool to draw the new budget constraint when the gasoline tax applies only to purchase of gasoline in excess of 10 gallons per week. Label this line 'L³¹. (Note: Be sure to draw the entire budget constraint, starting at a quantity of 0). Carefully follow the instructions above, and only draw the required objects. All other goods, Units per week 10 Gasoline, Gallons per week L¹ Q After plotting the final point of your multipoint curve, press the Esc key on your keyboard to end the line.arrow_forwardYou are choosing between two goods, X and Y, and your marginal utility from each is shown in the following table. Units of X MUx Units of Y MUy 1 10 1 8 2 8 2 7 3 6 3 6 4 4 4 5 5 3 5 4 6 2 6 3 a. If your income is $9 and the prices of X and Y are $2 and $1, respectively, what quantities of each will you purchase to maximize utility? ______units of X and ______units of Y b. What total utility will you realize? ______utils c. Assume that, other things remaining unchanged, the price of X falls to $1. What quantities of X and Y will you now purchase? _____units of X and ______units of Y d. Using the two prices and quantities for X, complete the table to derive the demand schedule (a table showing prices and quantities demanded) for X. Instructions: Start with the highest price first Price of X Quantity Demanded of X $ $arrow_forward

 Principles of Economics (12th Edition)EconomicsISBN:9780134078779Author:Karl E. Case, Ray C. Fair, Sharon E. OsterPublisher:PEARSON
 Engineering Economy (17th Edition)EconomicsISBN:9780134870069Author:William G. Sullivan, Elin M. Wicks, C. Patrick KoellingPublisher:PEARSON
 Principles of Economics (MindTap Course List)EconomicsISBN:9781305585126Author:N. Gregory MankiwPublisher:Cengage Learning
 Managerial Economics: A Problem Solving ApproachEconomicsISBN:9781337106665Author:Luke M. Froeb, Brian T. McCann, Michael R. Ward, Mike ShorPublisher:Cengage Learning
 Managerial Economics & Business Strategy (Mcgraw-...EconomicsISBN:9781259290619Author:Michael Baye, Jeff PrincePublisher:McGraw-Hill Education