
Videos
CASE STUDY Chrysalises for Cash
The butterfly symbolizes the notion of personal change. Increasingly, people are turning to butterflies to consecrate meaningful
Due to the possibility of introducing an invasive species, butterfly suppliers are monitored by governmental agencies. Along with following regulations, butterfly suppliers must ensure quality and quantity of their product while maintaining a profit. To this end, an individual supplier may hire independent contractors to hatch the varieties needed. These entrepreneurs are paid a small fee for each chrysalis delivered, with a 50% bonus added for each hatched healthy butterfly. This fee structure provides little room for profit. Therefore, it is important that these contractors deliver a high proportion of healthy butterflies that emerge at a fairly predictable rate.
In Florida, one such entrepreneur specializes in harvesting the black swallowtail butterfly. In nature, the female butterfly seeks plants, such as carrot and parsley, to harvest and lay eggs on. A newly hatched caterpillar consumes the host plant, then secures itself and sheds its skin, revealing a chrysalis. During this resting phase, environmental factors such as temperature and humidity may affect the transformation process. Typically, the black swallowtail takes about 1 week to complete its metamorphosis and emerge from its chrysalis. The transformation occasionally results in deformities
The Florida contractor believes that there are differences in quality and emergence time among his broods. Not having taken a scientific approach to the problem, he relies on his memory of seasons past. It seems to him that late-season butterflies emerge sooner and with a greater number of deformities than their early-season counterparts. He also speculates that the type and nutritional value of the food consumed by the caterpillar might contribute to any observed differences. This year he is committed to a more formal approach to his butterfly harvest.
Since it takes 2 days to deliver the chrysalises from the contractor to the supplier, it is important that the butterflies do not emerge prematurely. It is equally important that the number of defective butterflies be minimized. With these two goals in mind, the contractor seeks the best combination of food source, fertilizer, and brood season to maximize his profits. To examine the effects of these variables on emergence time and number of deformed butterflies, the entrepreneur designed the following experiment.
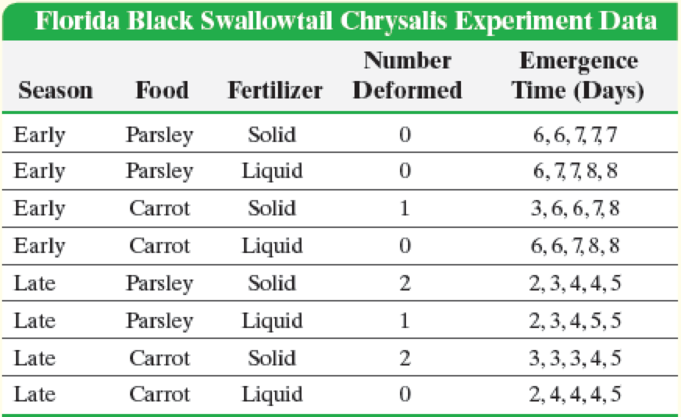
Eight identical pots were filled with equal amounts of a soil and watered carefully to ensure consistency. Two pots of carrot plants and two of parsley were set outside during the early part of the brood season. For the carrot pair, one pot was fed a fixed amount of liquid fertilizer, while the other was fed a nutritionally similar amount of solid fertilizer. The two pots of parsley were similarly fertilized. All four pots were placed next to each other to ensure similar exposures to environmental conditions such as temperature and solar radiation. Five black swallowtail caterpillars of similar age were placed into each container, each allowed to mature and form a chrysalis. The time from chrysalis formation until emergence was reported to the nearest day, along with any defects. The same procedure was followed with the four pots that were placed outdoors during the late brood season.
Write a report describing the experimental goals and design for the entrepreneur’s experiment. Follow the procedure outlined in the box on steps in designing and conducting an experiment (p. 44). Step 5(b), of this procedure is provided in the following table and should be included in your report.
In your report, provide a general descriptive analysis of these data. Be sure to include recommendations for the combination of season, food source, and type of fertilizer that result in the fewest deformed butterflies while achieving a long emergence time. Conclude your report with recommendations for further experiments. For each proposed experiment, be sure to do the following:
4. State the treatment.
Want to see the full answer?
Check out a sample textbook solution
Chapter 1 Solutions
MyLab Statistics with Pearson eText -- Standalone Access Card -- for Fundamentals of Statistics


- Cholesterol Cholesterol in human blood is necessary, but too much can lead to health problems. There are three main types of cholesterol: HDL (high-density lipoproteins), LDL (low-density lipoproteins), and VLDL (very low-density lipoproteins). HDL is considered “good” cholesterol; LDL and VLDL are considered “bad” cholesterol. A standard fasting cholesterol blood test measures total cholesterol, HDL cholesterol, and triglycerides. These numbers are used to estimate LDL and VLDL, which are difficult to measure directly. Your doctor recommends that your combined LDL/VLDL cholesterol level be less than 130 milligrams per deciliter, your HDL cholesterol level be at least 60 milligrams per deciliter, and your total cholesterol level be no more than 200 milligrams per deciliter. (a) Write a system of linear inequalities for the recommended cholesterol levels. Let x represent the HDL cholesterol level, and let y represent the combined LDL VLDL cholesterol level. (b) Graph the system of inequalities from part (a). Label any vertices of the solution region. (c) Is the following set of cholesterol levels within the recommendations? Explain. LDL/VLDL: 120 milligrams per deciliter HDL: 90 milligrams per deciliter Total: 210 milligrams per deciliter (d) Give an example of cholesterol levels in which the LDL/VLDL cholesterol level is too high but the HDL cholesterol level is acceptable. (e) Another recommendation is that the ratio of total cholesterol to HDL cholesterol be less than 4 (that is, less than 4 to 1). Identify a point in the solution region from part (b) that meets this recommendation, and explain why it meets the recommendation.arrow_forwardIn Example 5, after how many days are 250 students infected?arrow_forwardIn 2010, the U.S. Congress passed the historic health care reform bill that will provide some type of coverage for the 32 million Americans currently without health care insurance. Just how widespread is the lack of medical coverage? The media claim that the segments of the population most at risk for disease and thus needing healthcare are women, children, the elderly and the poor. The following tables were generated from the U.S. Census Bureau, Current Population Survey, Annual Social and Economic Supplement (2011). The tables report the number of uninsured (in thousands) by sex, by age, and by household income Is being insured or not dependent on the income groups identified in the analysis? Fill in the degrees of freedom and p-value in the output below and draw a clear conclusion indicating which income-groups are more at risk of not being insured if there is a significant relationship.arrow_forward
- In 2010, the U.S. Congress passed the historic health care reform bill that will provide some type of coverage for the 32 million Americans currently without health care insurance. Just how widespread is the lack of medical coverage? The media claim that the segments of the population most at risk for disease and thus needing healthcare are women, children, the elderly and the poor. The following tables were generated from the U.S. Census Bureau, Current Population Survey, Annual Social and Economic Supplement (2011). The tables report the number of uninsured (in thousands) by sex, by age, and by household income Is being insured or not dependent on the age groups identified in the analysis? Fill in the degrees of freedom and p-value in the output below and draw a clear conclusion indicating which age-groups are more at risk of not being insured if there is a significant relationshiparrow_forwardIn 2010, the U.S. Congress passed the historic health care reform bill that will provide some type of coverage for the 32 million Americans currently without health care insurance. Just how widespread is the lack of medical coverage? The media claim that the segments of the population most at risk for disease and thus needing healthcare are women, children, the elderly and the poor. The following tables were generated from the U.S. Census Bureau, Current Population Survey, Annual Social and Economic Supplement (2011). The tables report the number of uninsured (in thousands) by sex, by age, and by household income. Is being insured or not dependent on gender? Fill in the degrees of freedom and p-value in the output below and draw a clear conclusion indicating which gender is more at risk of not being insured if there is a significant difference.arrow_forwardIn 2010, the U.S. Congress passed the historic health care reform bill that will provide some type of coverage for the 32 million Americans currently without health care insurance. Just how widespread is the lack of medical coverage? The media claim that the segments of the population most at risk for disease and thus needing healthcare are women, children, the elderly and the poor. The following tables were generated from the U.S. Census Bureau, Current Population Survey, Annual Social and Economic Supplement (2011). Explain using supportive arguments from your analyses. Write a general summary paragraph identifying groups lacking in coverage by gender, age and income and commenting on the headline. Reference the observed numbers and percentages in your summary paragraph to see how the groups trend in identifying potentially more at-risk. Analysises for reference: Is being insured or not dependent on gender? Fill in the degrees of freedom and p-value in the output below and draw…arrow_forward
- Please do question 2-4. Thanksarrow_forwardSeveral years ago, two companies merged. One of the concerns after the merger was the increasing burden of retirement expenditures. An effort was made to encourage employees to participate in the 401(k) accounts. Nationwide, 67% of eligible workers participated in these accounts. The accompanying data table contains responses of 30 employees of the company when asked if they were currently participating in a 401(k) account. Complete parts a through d. Click the icon to view the data table. a. Determine the sample proportion of company workers who participate in 401(k) accounts. The sample proportion is (Round to three decimal places as needed.) b. Determine the sampling error if in reality the company workers have the same proportion of participants in 401(k) accounts as does the rest of the nation. The error is . (Round to three decimal places as needed.) c. Determine the probability that a sample proportion at least as large as that obtained in the sample would be obtained if the…arrow_forwardSeveral years ago, two companies merged. One of the concerns after the merger was the increasing burden of retirement expenditures. An effort was made to encourage employees to participate in the 401(k) accounts. Nationwide, 63% of eligible workers participated in these accounts. The accompanying data table contains responses of 30 employees of the company when asked if they were currently participating in a 401(k) account. Complete parts a through d. Click the icon to view the data table. a. Determine the sample proportion of company workers who participate in 401(k) accounts. The sample proportion is. (Round to three decimal places as needed.) b. Determine the sampling error if in reality the company workers have the same proportion of participants in 401(k) accounts as does the rest of the nation. The error is (Round to three decimal places as needed.) c. Determine the probability that a sample proportion at least as large as that obtained in the sample would be obtained if the…arrow_forward
- Several years ago, two companies merged. One of the concerns after the merger was the increasing burden of retirement expenditures. An effort was made to encourage employees to participate in the 401(k) accounts. Nationwide, 63% of eligible workers participated in these accounts. The accompanying data table contains responses of 30 employees of the company when asked if they were currently participating in a 401(k) account. Complete parts a through d. Click the icon to view the data table. a. Determine the sample proportion of company workers who participate in 401(k) accounts. The sample proportion is. (Round to three decimal places as needed.) b. Determine the sampling error if in reality the company workers have the same proportion of participants in 401(k) accounts as does the rest of the nation. The error is (Round to three decimal places as needed.) c. Determine the probability that a sample proportion at least as large as that obtained in the sample would be obtained if the…arrow_forwardSeveral years ago, two companies merged. One of the concerns after the merger was the increasing burden of retirement expenditures. An effort was made to encourage employees to participate in the 401(k) accounts. Nationwide, 62% of eligible workers participated in these accounts. The accompanying data table contains responses of 30 employees of the company when asked if they were currently participating in a 401(k) account. Complete parts a through d. Click the icon to view the data table. a. Determine the sample proportion of company workers who participate in 401(k) accounts. The sample proportion is (Round to three decimal places as needed.) b. Determine the sampling error if in reality the company workers have the same proportion of participants in 401(k) accounts as does the rest of the nation. The error is. (Round to three decimal places as needed.) c. Determine the probability that a sample proportion at least as large as that obtained in the sample would be obtained if the…arrow_forwardWhen a law firm represents a group of people in a class action lawsuit and wins that lawsuit, the firm receives a percentage of the group's monetary settlement. That settlement amount is based on the total number of people in the group – the larger the group and the larger the settlement, the more money the firm will receive. A law firm is trying to decide whether to represent car owners in a class action lawsuit against the manufacturer of a certain make and model for a particular defect. If 5 percent or less of the cars of this make and model have the defect, the firm will not recover its expenses. Therefore, the firm will handle the lawsuit only if it is convinced that more than 5 percent of cars of this make and model have the defect. The firm plans to take a random sample of 1000 people who bought this car and ask them if they experienced this defect in their cars. From the perspective of the law firm, would you recommend that the significance level of a = 0.01 or a = 0.10 be used…arrow_forward

 Glencoe Algebra 1, Student Edition, 9780079039897...AlgebraISBN:9780079039897Author:CarterPublisher:McGraw Hill
 Holt Mcdougal Larson Pre-algebra: Student Edition...AlgebraISBN:9780547587776Author:HOLT MCDOUGALPublisher:HOLT MCDOUGAL
 Algebra & Trigonometry with Analytic GeometryAlgebraISBN:9781133382119Author:SwokowskiPublisher:Cengage
 Algebra: Structure And Method, Book 1AlgebraISBN:9780395977224Author:Richard G. Brown, Mary P. Dolciani, Robert H. Sorgenfrey, William L. ColePublisher:McDougal Littell
 Trigonometry (MindTap Course List)TrigonometryISBN:9781337278461Author:Ron LarsonPublisher:Cengage Learning