
Videos
CASE STUDY Chrysalises for Cash
The butterfly symbolizes the notion of personal change. Increasingly, people are turning to butterflies to consecrate meaningful
Due to the possibility of introducing an invasive species, butterfly suppliers are monitored by governmental agencies. Along with following regulations, butterfly suppliers must ensure quality and quantity of their product while maintaining a profit. To this end, an individual supplier may hire independent contractors to hatch the varieties needed. These entrepreneurs are paid a small fee for each chrysalis delivered, with a 50% bonus added for each hatched healthy butterfly. This fee structure provides little room for profit. Therefore, it is important that these contractors deliver a high proportion of healthy butterflies that emerge at a fairly predictable rate.
In Florida, one such entrepreneur specializes in harvesting the black swallowtail butterfly. In nature, the female butterfly seeks plants, such as carrot and parsley, to harvest and lay eggs on. A newly hatched caterpillar consumes the host plant, then secures itself and sheds its skin, revealing a chrysalis. During this resting phase, environmental factors such as temperature and humidity may affect the transformation process. Typically, the black swallowtail takes about 1 week to complete its metamorphosis and emerge from its chrysalis. The transformation occasionally results in deformities
The Florida contractor believes that there are differences in quality and emergence time among his broods. Not having taken a scientific approach to the problem, he relies on his memory of seasons past. It seems to him that late-season butterflies emerge sooner and with a greater number of deformities than their early-season counterparts. He also speculates that the type and nutritional value of the food consumed by the caterpillar might contribute to any observed differences. This year he is committed to a more formal approach to his butterfly harvest.
Since it takes 2 days to deliver the chrysalises from the contractor to the supplier, it is important that the butterflies do not emerge prematurely. It is equally important that the number of defective butterflies be minimized. With these two goals in mind, the contractor seeks the best combination of food source, fertilizer, and brood season to maximize his profits. To examine the effects of these variables on emergence time and number of deformed butterflies, the entrepreneur designed the following experiment.
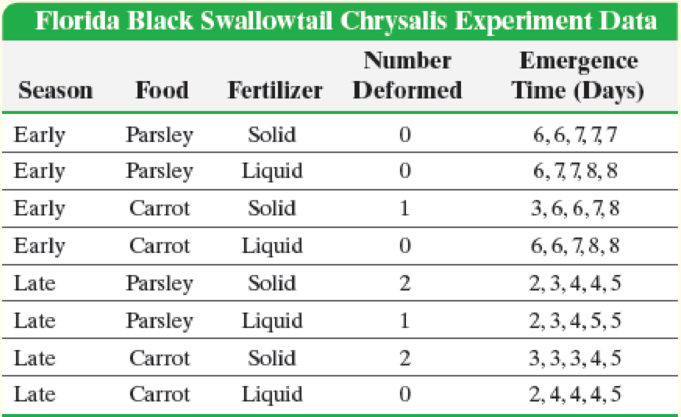
Eight identical pots were filled with equal amounts of a soil and watered carefully to ensure consistency. Two pots of carrot plants and two of parsley were set outside during the early part of the brood season. For the carrot pair, one pot was fed a fixed amount of liquid fertilizer, while the other was fed a nutritionally similar amount of solid fertilizer. The two pots of parsley were similarly fertilized. All four pots were placed next to each other to ensure similar exposures to environmental conditions such as temperature and solar radiation. Five black swallowtail caterpillars of similar age were placed into each container, each allowed to mature and form a chrysalis. The time from chrysalis formation until emergence was reported to the nearest day, along with any defects. The same procedure was followed with the four pots that were placed outdoors during the late brood season.
Write a report describing the experimental goals and design for the entrepreneur’s experiment. Follow the procedure outlined in the box on steps in designing and conducting an experiment (p. 44). Step 5(b), of this procedure is provided in the following table and should be included in your report.
In your report, provide a general descriptive analysis of these data. Be sure to include recommendations for the combination of season, food source, and type of fertilizer that result in the fewest deformed butterflies while achieving a long emergence time. Conclude your report with recommendations for further experiments. For each proposed experiment, be sure to do the following:
3. State the number of experimental units.
Want to see the full answer?
Check out a sample textbook solution
Chapter 1 Solutions
MyLab Statistics with Pearson eText -- Standalone Access Card -- for Fundamentals of Statistics


- Cholesterol Cholesterol in human blood is necessary, but too much can lead to health problems. There are three main types of cholesterol: HDL (high-density lipoproteins), LDL (low-density lipoproteins), and VLDL (very low-density lipoproteins). HDL is considered “good” cholesterol; LDL and VLDL are considered “bad” cholesterol. A standard fasting cholesterol blood test measures total cholesterol, HDL cholesterol, and triglycerides. These numbers are used to estimate LDL and VLDL, which are difficult to measure directly. Your doctor recommends that your combined LDL/VLDL cholesterol level be less than 130 milligrams per deciliter, your HDL cholesterol level be at least 60 milligrams per deciliter, and your total cholesterol level be no more than 200 milligrams per deciliter. (a) Write a system of linear inequalities for the recommended cholesterol levels. Let x represent the HDL cholesterol level, and let y represent the combined LDL VLDL cholesterol level. (b) Graph the system of inequalities from part (a). Label any vertices of the solution region. (c) Is the following set of cholesterol levels within the recommendations? Explain. LDL/VLDL: 120 milligrams per deciliter HDL: 90 milligrams per deciliter Total: 210 milligrams per deciliter (d) Give an example of cholesterol levels in which the LDL/VLDL cholesterol level is too high but the HDL cholesterol level is acceptable. (e) Another recommendation is that the ratio of total cholesterol to HDL cholesterol be less than 4 (that is, less than 4 to 1). Identify a point in the solution region from part (b) that meets this recommendation, and explain why it meets the recommendation.arrow_forwardIn Example 5, after how many days are 250 students infected?arrow_forwardhelp please answer in text form with proper workings and explanation for each and every part and steps with concept and introduction no AI no copy paste remember answer must be in proper format with all workingarrow_forward
- A. Movie Theatre Admissions. The following bar graph shows the number of U.S. and Canada movie theatre admissions for the years from 2007 to 2014. 1.50 1.45 1.40 1.35 1.30 1.25 1.20 0.00 2011 2014 Total U.S. and Canada movie theatre admissions SOURCE: National Association of Theatre Owners Question: 1. Estimate the number of admissions for the year 2009. Round to the nearest tenth of a billion. Answer: 2. Which year had the least number of admissions? Answer: 3. Which year had the greatest number of admissions? Answer: | B. Determine whether the argument is an example of inductive reasoning or deductive reasoning. 1. Emma enjoyed reading the novel Finders Keepers by Stephen King, so she will enjoy reading his next novel. Answer: 2. Every English setter likes to hunt. Duke is an English setter, so Duke likes to hunt. Answer: 3. All home improvements cost more than the estimate. The contractor estimated that my home improvement will cost $35,000. Thus my home improvement will cost more…arrow_forwardHealthy Sleep Duration. The Centers for Disease Control and Prevention (CDC) define a healthy sleep duration to be at least seven hours per day. The CDC reports that the percentage of people who report a healthy sleep duration varies by marital status. The CDC also reports that in 2018, 67% of those who are married report a healthy sleep duration; 62% of those who have never been married report a healthy sleep duration; and 56% of those who are divorced, widowed, or separated report a healthy sleep duration. The file SleepHabits contains sample data on the sleeping habits of people who have never been married that are consistent with the CDC’s findings. Use these data to answer the following questions. Develop a point estimate and a 95% confidence interval for the proportion of those who have never been married who report a healthy sleep duration. Develop a point estimate and a 95% confidence interval for the mean number of hours of sleep for those who have never been married. For…arrow_forwardThe Lawson Fabric Mill Produces five different fabrics. Each fabric can be woven on one or more of the mill’s 36 looms. The sales department’s forecast of demand for the next month is shown in below Table 1, along with data on the selling price per yard, variable cost per yard, and purchase price per yard. The mill operates 24 hours a day and is scheduled for 30 days during the coming month. The mill has two types of looms: draw and regular. The draw looms are more versatile and can be used for all five fabrics. The regular looms can produce only three of the fabrics. The mill has a total of 36 looms: 8 are draw and 28 are regular. The rate of production for each fabric on each type of loom is given in below Table 2. The time required to change over from producing one fabric to another is negligible and does not have to be considered. The Lawson Fabric Mill satisfies all demand with either its own fabric or fabric purchased from another mill. Fabrics that cannot be woven at the…arrow_forward
- Charity Navigator is America's leading independent charity evaluator. The following data show the total expenses ($), the percentage of the total budget spent on administrative expenses, the percentage spent on fundraising, and the percentage spent on program expenses for 10 supersized charities (Charity Navigator website). Administrative expenses include overhead, administrative staff and associated costs, and organizational meetings. Fundraising expenses are what a charity spends to raise money, and program expenses are what the charity spends on the programs and services it exists to deliver. The sum of the three percentages does not add to 100% because of rounding. Do not round your intermediate calculations. Total Administrative Fundraising Program Expenses Expenses Expenses Expenses Charity (millions of $) (%) (%) (%) 1 American Red Cross 3350 3.7 3.8 92.0 2 World Vision 1210 3.8 7.8 88.3 3 Smithsonian Institution 1080 23.8 2.3 73.8 4 Food For The Poor 1052 0.7 2.1 96.7 5…arrow_forwardCharity Navigator is America's leading independent charity evaluator. The following data show the total expenses ($), the percentage of the total budget spent on administrative expenses, the percentage spent on fundraising, and the percentage spent on program expenses for 10 supersized charities (Charity Navigator website). Administrative expenses include overhead, administrative staff and associated costs, and organizational meetings. Fundraising expenses are what a charity spends to raise money, and program expenses are what the charity spends on the programs and services it exists to deliver. The sum of the three percentages does not add to 100% because of rounding. Do not round your intermediate calculations. Total Administrative Fundraising Program Expenses Expenses Expenses Expenses Charity (millions of $) (%) (%) (%) 1 American Red Cross 3352 3.9 3.9 92.3 2 World Vision 1205 4.1 7.5 88.3 3 Smithsonian Institution 1082 23.4 2.6 73.9 4 Food For The Poor 1048 0.5 2.3 96.9 5…arrow_forwardCharity Navigator is America's leading independent charity evaluator. The following data show the total expenses ($), the percentage of the total budget spent on administrative expenses, the percentage spent on fundraising, and the percentage spent on program expenses for 10 supersized charities (Charity Navigator website). Administrative expenses include overhead, administrative staff and associated costs, and organizational meetings. Fundraising expenses are what a charity spends to raise money, and program expenses are what the charity spends on the programs and services it exists to deliver. The sum of the three percentages does not add to 100% because of rounding. Do not round your intermediate calculations. Charity Total Administrative Fundraising Program Expenses Expenses Expenses Expenses (millions of $) (%) Fundraising Program 1 American Red Cross 3352 3.9 3.9 92.2 2 World Vision 1210 3.8 7.8 88.6 3 Smithsonian Institution 1082 23.5 2.6 73.6 4 Food For…arrow_forward

 Glencoe Algebra 1, Student Edition, 9780079039897...AlgebraISBN:9780079039897Author:CarterPublisher:McGraw Hill
 Holt Mcdougal Larson Pre-algebra: Student Edition...AlgebraISBN:9780547587776Author:HOLT MCDOUGALPublisher:HOLT MCDOUGAL
 Algebra & Trigonometry with Analytic GeometryAlgebraISBN:9781133382119Author:SwokowskiPublisher:Cengage
 Algebra: Structure And Method, Book 1AlgebraISBN:9780395977224Author:Richard G. Brown, Mary P. Dolciani, Robert H. Sorgenfrey, William L. ColePublisher:McDougal Littell
 Trigonometry (MindTap Course List)TrigonometryISBN:9781337278461Author:Ron LarsonPublisher:Cengage Learning