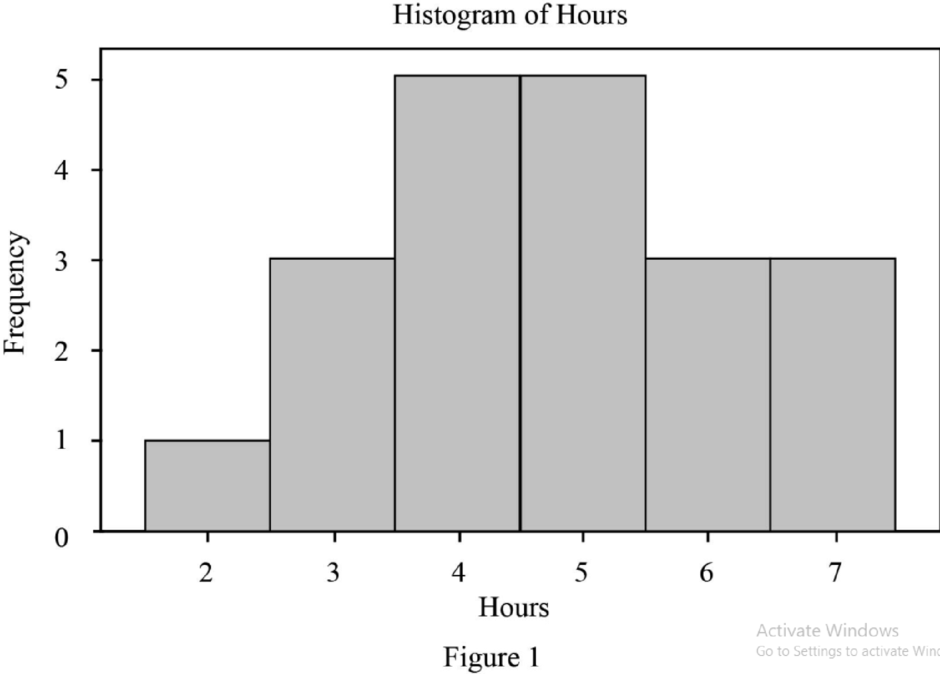
Draw the histogram of hours for 20 students.
Explanation of Solution
Figure-1 illustrates the histogram of hours for 20 students as follows:
Stem-and-leaf display:
The stem-and-leaf display is an exploratory data analysis (EDA) that is an alternative method of histogram in which data are grouped according to their leading digits, it is called ‘stems’, and the final digits, called ‘leafs, are listed separately for each member of a class. Here, the leaves are displayed individually in the ascending order after each of the steams.
Table 1 indicates the stem-and-leaf display using the given data (Data file Sun).
| Table -1 | |||||
| Stem | Leaf | ||||
| 2 | 4 | ||||
| 2 | 8 | 9 | |||
| 3 | 0 | ||||
| 3 | 6 | 6 | 9 | ||
| 4 | 0 | 4 | |||
| 4 | 5 | 6 | 8 | ||
| 5 | 0 | 2 | |||
| 5 | 5 | 8 | |||
| 6 | 2 | ||||
| 6 | 5 | 7 | |||
| 7 | 3 | ||||
Histogram: A histogram is a graph in which the vertical bars constructed on a horizontal line are marked off with intervals for the variable being displayed.
Want to see more full solutions like this?
Chapter 1 Solutions
EBK STATISTICS FOR BUSINESS AND ECONOMI

- Now suppose that you instead observe the value of exports for all the different products (e.g., corn, soybeans, pork, dairy products, etc.) that Colombia purchases from the US from 2000 to 2019. What type of data is this? Group of answer choices Panel Random sample Time-series Cross-sectionalarrow_forwardWhat do you mean by Scatterplots, the Sample Covariance, and the Sample Correlation?arrow_forwardA wedding photographer made $500 on average in the 5 years it has been operational. Asample of 12 months were analyzed and it was found that he made an average of $620.i. Does the value $500 refer to the parameter or to the statistic? ii. Is the value $620 a parameter or a statistic? iii. State two advantages of using a sample statistic rather than a parameter.arrow_forward
- Choose the correct statement about the following histogram. 1. The histogram is skewed to the left because it has a shorter tail to the left. 2. The histogram is skewed to the left because it has a longer tail to the left. 3. The histogram is skewed to the right because it has a shorter tail to the right. 4. The histogram is skewed to the right because it has a longer tail to the right.arrow_forwardResidents in one housing development were asked a series of questions by their homeowners’ association. Identify the type of data for each question.a. Did you play golf during the last month on the development’s new golf course?b. How many times have you eaten at the country club restaurant during the last month?c. Do you own a camper?d. Rate the new security system for the development (very good, good, poor, or very poor).arrow_forwardHow do we calculate mean deviation?Discuss its significance and use in variousconcepts of statistics. How it differs fromquartile deviationarrow_forward
- Values of height in inches (X) and weight in pounds (Y) are recorded froma sample of 200 male college students. The resulting summary statistics arex̄ = 71.2 in, ȳ= 164 lb., sX = 1.9 in, sY = 16.4 lb., sXY = 22.54 in. X lb.,and rXY = 0.8. Convert these statistics to the metric system (meters andkilograms).arrow_forwardwhat is an example of a purchases requisition sample? give a sample of purchases reuqisitonarrow_forwardSolve the second graph! plsssarrow_forward
- You are given the following dataset from a sample of the population. Superhero Number of Villains Captured Number of Losses Average Hours of Sleep Spiderham 30 9 12 Alligator Loki 50 1 23 Iron Man 20 8 6 Phil Coulson 18 2 8 Yelena Belova 25 5 2 Round all answers to 2 decimal places. IE: 3.567 = 3.57 A. What kind of dataset is this? Answer either Panel, Time series, or cross sectional B. Calculate the average number of villains captured in this sample. C. Calculate the variance of the number of villains captured in this sample. D. Calculate the correlation between the number of villains captured and average hours of sleep . If answer is negative, include negative sign. E. Calculate the sample covariance between the average number of losses and average hours of sleep . If answer is negative, include negative sign.arrow_forwardWhat is the lowest level of measurement for the data where the mode could bedetermined?A. NominalB. OrdinalC. IntervalD. Ratio Consider a data set of 11 distinct measurements with mean equal to A and median equalto B. If the highest value was decreased to a value smaller than the median B, how wouldthe mean and median be affected?A. The mean and median will both decrease.B. The mean and median will not change.C. The mean will not change and the median will decrease.D. The mean will decrease and the median will not change. What is one distinction between a parameter and a statistic?A. A parameter is only based on conceptual measurements, but a statistic is basedon a combination of real and conceptual measurements.B. A statistic changes every time you try to measure it (using different samples), but aparameter remains fixed.C. A parameter changes each time you try to measure it, but a statistic remains fixedacross samples.D. The true value of a statistic can never be known but the true…arrow_forwardConsider the following data:Number of Customers a Restaurant Serves per Year Year 20002000 20012001 20022002 20032003 20042004 20052005 20062006 20072007 20082008 Customers 16,56516,565 17,13517,135 15,25815,258 14,36914,369 15,92915,929 16,76116,761 16,90216,902 18,65918,659 16,64616,646 Step 1 of 2 : Find the two-period weighted moving average for the year 20072007 with weights of 33 (one time period in past) and 11 (two time periods in past). If necessary, round your answer to one decimal place.arrow_forward

 Principles of Economics (12th Edition)EconomicsISBN:9780134078779Author:Karl E. Case, Ray C. Fair, Sharon E. OsterPublisher:PEARSON
 Engineering Economy (17th Edition)EconomicsISBN:9780134870069Author:William G. Sullivan, Elin M. Wicks, C. Patrick KoellingPublisher:PEARSON
 Principles of Economics (MindTap Course List)EconomicsISBN:9781305585126Author:N. Gregory MankiwPublisher:Cengage Learning
 Managerial Economics: A Problem Solving ApproachEconomicsISBN:9781337106665Author:Luke M. Froeb, Brian T. McCann, Michael R. Ward, Mike ShorPublisher:Cengage Learning
 Managerial Economics & Business Strategy (Mcgraw-...EconomicsISBN:9781259290619Author:Michael Baye, Jeff PrincePublisher:McGraw-Hill Education