The images of trees in Figure P1.68 come from a catalog advertising fast-growing trees. If we mark the position of the top of the tree in the successive years, as shown in the graph in the figure, we obtain a motion diagram much like ones we have seen for other kinds of motion. The motion isn't steady, of course. In some months the tree grows rapidly; in other months, quite slowly. We can see, though, that the average speed of growth is fairly constant for the first few years. Figure P1.68 68. What is the tree's speed of growth, in feet per year, from t = 1 yr to t = 3 yr? A. 12 ft/yr B. 9 ft/yr C. 6 ft/yr D. 3 ft/yr
The images of trees in Figure P1.68 come from a catalog advertising fast-growing trees. If we mark the position of the top of the tree in the successive years, as shown in the graph in the figure, we obtain a motion diagram much like ones we have seen for other kinds of motion. The motion isn't steady, of course. In some months the tree grows rapidly; in other months, quite slowly. We can see, though, that the average speed of growth is fairly constant for the first few years. Figure P1.68 68. What is the tree's speed of growth, in feet per year, from t = 1 yr to t = 3 yr? A. 12 ft/yr B. 9 ft/yr C. 6 ft/yr D. 3 ft/yr
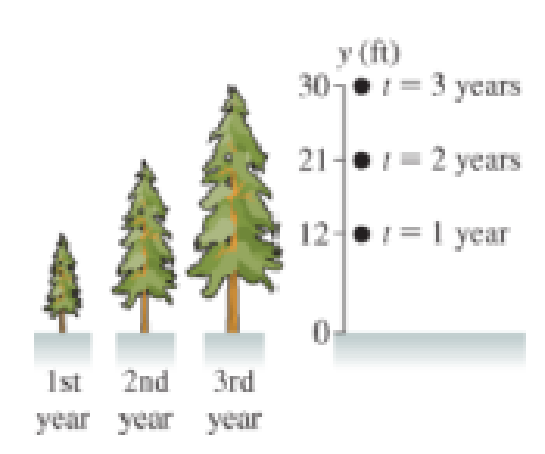
The images of trees in Figure P1.68 come from a catalog advertising fast-growing trees. If we mark the position of the top of the tree in the successive years, as shown in the graph in the figure, we obtain a motion diagram much like ones we have seen for other kinds of motion. The motion isn't steady, of course. In some months the tree grows rapidly; in other months, quite slowly. We can see, though, that the average speed of growth is fairly constant for the first few years.
Figure P1.68
68. What is the tree's speed of growth, in feet per year, from t = 1 yr to t = 3 yr?
On a two-leg trip, a car travels the first leg, a distance D1 = 44 miles, in a time t1 = 1.05 hours, and travels the second leg, a distance D2 = 131 miles, in time t2 = 2.2 hours. Refer to the figure.
On a two-leg trip, a car travels the first leg, a distance D1 = 44 miles, in a time t1 = 1.05 hours, and travels the second leg, a distance D2 = 131 miles, in time t2 = 2.2 hours. Refer to the figure.
Part (a) In miles per hour, what is the average speed of the car during the first leg?Numeric : A numeric value is expected and not an expression.vavg1 = __________________________________________Part (b) In miles per hour, what is the average speed of the car during the second leg?Numeric : A numeric value is expected and not an expression.vavg2 = __________________________________________Part (c) In miles per hour, what is the average speed of the car over the entire trip?Numeric : A numeric value is expected and not an…
If the distance dd (in meters) traveled by an object in time tt (in seconds) is given by the formula d=A+Bt2d=A+Bt2, the SI units of AA and BB must be
meters for both AA and BB.
m/sm/s for AA and m/s2m/s2 for BB.
meters for AA and m/s2m/s2 for BB.
m/s2m/s2 for both AA and BB.
In an 8.00 kmkm race, one runner runs at a steady 11.2 km/hkm/h and another runs at 14.9 km/hkm/h.
How far from the finish line is the slower runner when the faster runner finishes the race?
Express your answer in kilometers to three significant figures.
Chapter 1 Solutions
Modified Mastering Physics with Pearson eText -- Standalone Access Card -- for College Physics: A Strategic Approach (3rd Edition)
Physics for Scientists and Engineers: A Strategic Approach, Vol. 1 (Chs 1-21) (4th Edition)
Knowledge Booster
Learn more about
Need a deep-dive on the concept behind this application? Look no further. Learn more about this topic, physics and related others by exploring similar questions and additional content below.


 Principles of Physics: A Calculus-Based TextPhysicsISBN:9781133104261Author:Raymond A. Serway, John W. JewettPublisher:Cengage Learning
 Physics for Scientists and Engineers with Modern ...PhysicsISBN:9781337553292Author:Raymond A. Serway, John W. JewettPublisher:Cengage Learning
 Physics for Scientists and Engineers: Foundations...PhysicsISBN:9781133939146Author:Katz, Debora M.Publisher:Cengage Learning
 Glencoe Physics: Principles and Problems, Student...PhysicsISBN:9780078807213Author:Paul W. ZitzewitzPublisher:Glencoe/McGraw-Hill
 College PhysicsPhysicsISBN:9781305952300Author:Raymond A. Serway, Chris VuillePublisher:Cengage Learning