
(a)
Interpretation:
The least square analysis needs to be performed to determine the intercept, slopeand regression statistics, including the standard deviation about regression.
Concept introduction:
The least square analysis is defined as the method in which the final answer for the set of data points is calculated by the minimizing the summation of residue of set of data point from the given curve.
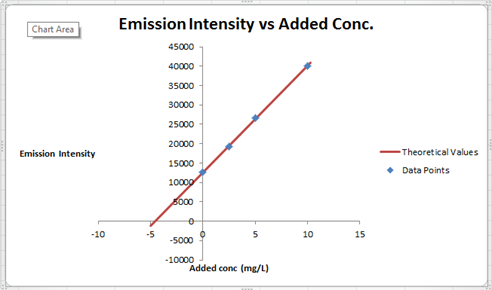
The equation for straight line is represented as follows:
Answer to Problem 10.11QAP
To satisfy the equation
Explanation of Solution
Least Square Analysis

The summary of calculation is as follows.
| Added Au | Emission Intensity (y) | ||
| 0 | 12568 | ||
| 2.5 | 19324 | ||
| 5 | 26622 | ||
| 10 | 40021 | ||
| m | c | 2752.72 | 12590.6 |
| sm | sb | 30.7796445 | 176.3126 |
| r2 | sy | 0.99975001 | 227.6185 |
Here, the sigma values focus on the errors present in the parameter.
So far, we have filled
Now, we must determine the concentration of gold and its uncertainty. The concentration of gold is x. intercept of the graph, because that is the point at which the gold is absence so the difference between that and the zero added point must be the gold concentration in sample.
Now, x is a function of c and m. Thus, the uncertainty in them will be propagated to x as well. We have the following since m and c are independent.
x = x(m,c)
By propagation of uncertainty,
This is, however, the standard error. Assuming the distribution of value to be normal about the value of x, this value would give an interval of 63.5% probability. However, if we want a 95% probability interval, we will have to multiply the error in x by 1.96.
(b)
Interpretation:
The concentration of gold in the sample solution in mg/L needs to be determined using the calculated values.
Concept introduction:
The least square analysis is defined as the method in which the final answer for the set of data points is calculated by the minimizing the summation of residue of set of data point from the given curve.
The equation for straight line is represented as follows:
Answer to Problem 10.11QAP
Concentration of gold in sample =
Explanation of Solution
Least Square Analysis
The summary of calculation is as follows.
| Added Au | Emission Intensity (y) | ||
| 0 | 12568 | ||
| 2.5 | 19324 | ||
| 5 | 26622 | ||
| 10 | 40021 | ||
| m | c | 2752.72 | 12590.6 |
| sm | sb | 30.7796445 | 176.3126 |
| r2 | sy | 0.99975001 | 227.6185 |
Here, the sigma values focus on the errors present in the parameter.
So far, we have filled
Now, we must determine the concentration of gold and its uncertainty. The concentration of gold is x. intercept of the graph, because that is the point at which the gold is absence so the difference between that and the zero added point must be the gold concentration in sample.
Now, x is a function of c and m. Thus, the uncertainty in them will be propagated to x as well. We have the following since m and c are independent.
x = x(m,c)
By propagation of uncertainty,
This is however, the standard error. Assuming the distribution of value to be normal about the value of x, this value would give an interval of 63.5% probability. However, if we want a 95% probability interval, we will have to multiply the error in x by 1.96.
Concentration of gold in sample =
(c)
Interpretation:
The concentration of gold in the sample is 8.51 mg/L needs to be determined and the hypothesis that the results equals the 95% confidence level needs to be tested.
Concept introduction:
The least square analysis is defined as the method in which the final answer for the set of data points is calculated by the minimizing the summation of residue of set of data point from the given curve.
The equation for straight line is represented as follows:
Answer to Problem 10.11QAP
Considering a confidence interval of 95% we have concentration of
Explanation of Solution
Least Square Analysis

The summary of calculation is as follows.
| Added Au | Emission Intensity (y) | ||
| 0 | 12568 | ||
| 2.5 | 19324 | ||
| 5 | 26622 | ||
| 10 | 40021 | ||
| m | c | 2752.72 | 12590.6 |
| sm | sb | 30.7796445 | 176.3126 |
| r2 | sy | 0.99975001 | 227.6185 |
Here, the sigma values focus on the errors present in the parameter.
So far, we have filled
Now, we must determine the concentration of gold and its uncertainty. The concentration of gold is x. intercept of the graph, because that is the point at which the gold is absence so the difference between that and the zero added point must be the gold concentration in sample.
Now, x is a function of c and m. Thus, the uncertainty in them will be propagated to x as well. We have the following since m and c are independent.
x = x(m,c)
By propagation of uncertainty,
This is however, the standard error. Assuming the distribution of value to be normal about the value of x, this value would give an interval of 63.5% probability. However, if we want a 95% probability interval, we will have to multiply the error in x by 1.96.
Considering a confidence interval of 95% we have concentration of
Want to see more full solutions like this?
Chapter 10 Solutions
Principles of Instrumental Analysis

- Equations for the chemiluminescence determination of SO2 are given on page 383. Derive an expression for the relationship between the concentration of SO2 in a sample, the luminescence intensity, and the equilibrium constant for the first reaction.arrow_forwardCalcium in powdered milk is determined by dry ashing a 3.00g sample then titrating the calcium with 12.10mL EDTA solution. The EDTA was standardized by titrating 10.00mL of a Zn solution by dissolving 0.632g Zn metal in acid and dilution to 1.00L (10.80 mL EDTA required for titration). What is the concentration of Ca in the powdered milk in ppm?arrow_forwardLead in dry river sediment was extracted with 25 wt% HNO3 at incubation temperatures for 1 hr. Then 1 mL of filtered extract was combined with other reagents to a total of 4.60 mL. Pb+2 was measured by an electrochemical method by spiking with 2.50 ppm Pb2+. added vol. of 2.50ppm Pb2 signal 0 mL 1.10 0.025 mL 1.66 .050 mL 2.20 .075 mL 2.81 what is Sx based on Syarrow_forward
- Can electrogravimetry give total copper concentration and determine the concentration of specific species of either Cu(II) or Cu (I)? Why? And does it require a standard calibration curve? If not, how can the amount of analyte be determined?What about Polarography?arrow_forwardThe determination of iron in wines was carried out by atomic absorption spectrophotometry, using the standard addition method. To do this, 10 mL of wine were placed in five 50 mL volumetric flasks; then 0, 5, 10, 15 and 20 mL of a 10 ppm iron standard solution were added to each of them. Next, they were gauged with distilled water and the absorbance was measured, obtaining the values of 0.040, 0.062, 0.081, 0.102 and 0.125 respectively. Calculate the regression parameters and obtain the iron concentration in the wine, in µg / mL.arrow_forwardA titrimetric method for the determination of calcium in limestone was tested by analysis of an NIST limestone containing 30.15% CaO. The mean result of four analyses was 30.26% CaO, with a standard deviation of 0.085%. By pooling data from several analyses, it was established that s = 0.094% CaO.a. Do the data indicate the presence of a systematic error at the 95% confidence level?b. Do the data indicate the presence of systematic error at the 95% confidence level if no pooled value for s was available?arrow_forward
- Five white, 500-mg uncoated ascorbic acid (AA) tablets with an average weight of 0.6100-g were pulverized in a mortar. A sample of the powdered ascorbic acid weighing 0.4610-g was placed in an iodine flask and was dissolved in 50-mL H2SO4 then 5-g of KBr was added to the resulting solution. The solution was titrated with 46.73-mL of 0.0152 M STD. KBrO3 to reach a faint yellow endpoint then 3-g KI and 5-mL Starch TS. The blue color solution is then titrated with 2.78-mL of 0.1047 M STD. Na2S2O3 to reach the disappearance of the blue iodostarch complex. MW: KBrO3 = 167.0 ; KIO3 = 214.0 ; Na2S2O3 = 158.11 ; C6H8O6 = 176.12 Compute the milligrams of pure AA per tablet from the assay. None of the choices 349.7 mg 264.3 mg 462.7 mgarrow_forwardA sample of iron ore weighing 800 mg was treated with HNO3 , boiled to dryness and redissolved in dilute HCl. After filtration and removal of undissolved silica, the liquid was passed through a Walden reductor. The collected sample was titrated with 0.0210 M KMnO4 , requiring 12.0 mL to reach the end point. Calc %Fe (55.845) in the ore.arrow_forwardEx(1): In the analysis for chloride. The sample weighed (0.8732 gm) and the AgCl (p.p.t) from the sample weighed (1.0292 gm). Calculate the precent of chloride in the sample. At. wt. of Cl= 35.5, Ag = %3D 101.88.arrow_forward
- A foot powder sample containing Zn was dissolved on 50.00 mL water and was titrated to the end point color with 22.57 mL of 0.01639 M EDTA at pH=4. (α= 3.61x10⁹, KKzny2 = 3.2 x 10¹⁶). The pZn in the sample is:arrow_forwardThe standard curve was made by spectrophotographic analysis of equilibrated iron(III) thiocyanate solutions of known concentration. You are asked to analyze a Fe(SCN)2+Fe(SCN)2+ solution with an unknown concentration and an absorbance value of 0.4150.415 . The slope-intercept form of the equation of the line is ?=4558.4?+0.0147y=4558.4x+0.0147 . The unknown was analyzed on the same instrument as the standard curve solutions at the same temperature. What is the Fe3+Fe3+ concentration of the unknown solution?arrow_forwardCalculate the hardness in terms of parts per million calcium carbonate (100.0869 g/mol) in a 50.00 mL aliquot of milk sample. The sample was treated with a small amount of ammonia buffer to bring the pH to 10 followed by the addition of 10 drops EBT indicator. The milk sample required 10.00 mL of 8.000 x 10⁻³ M EDTA for titration. 160 ppm 4 80 320arrow_forward
 Principles of Instrumental AnalysisChemistryISBN:9781305577213Author:Douglas A. Skoog, F. James Holler, Stanley R. CrouchPublisher:Cengage Learning