ELEMENTARY STATISTICS-TEXT (LL)
9th Edition
ISBN: 9780077665708
Author: Bluman
Publisher: MCG
Question
Book Icon
Chapter 10, Problem 10.1.7RE

a.

To determine

To construct: The scatterplot for the give data.

a.

Expert Solution
Check Mark

Answer to Problem 10.1.7RE

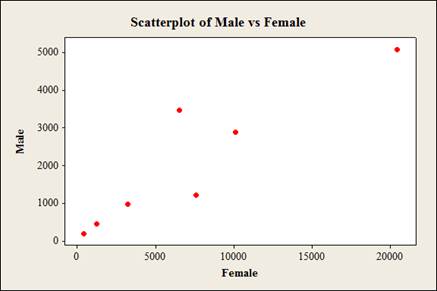
The scatterplot for the data is as follows,

ELEMENTARY STATISTICS-TEXT (LL), Chapter 10, Problem 10.1.7RE , additional homework tip  1

Explanation of Solution

Given info:

The data represents the numbers of male and female physicians.

Calculation:

Software procedure:

Step by step procedure to obtain scatterplot using the MINITAB software:

  • Choose Graph > Scatterplot.
  • Choose Simple and then click OK.
  • Under Y variables, enter a column of Male.
  • Under X variables, enter a column of Female.
  • Click OK.

b.

To determine

To compute: The value of the correlation coefficient.

b.

Expert Solution
Check Mark

Answer to Problem 10.1.7RE

The value of the correlation coefficient is 0.907.

Explanation of Solution

Calculation:

Correlation coefficient r:

Software Procedure:

Step-by-step procedure to obtain the ‘correlation coefficient’ using the MINITAB software:

  • Select Stat >Basic Statistics > Correlation.
  • In Variables, select Male and Female from the box on the left.
  • Click OK.

Output using the MINITAB software is given below:

ELEMENTARY STATISTICS-TEXT (LL), Chapter 10, Problem 10.1.7RE , additional homework tip  2

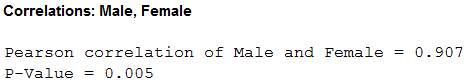
Thus, the value of the correlation is 0.907.

c.

To determine

To test: The significance of the correlation coefficient at α=0.01 using Table I.

c.

Expert Solution
Check Mark

Answer to Problem 10.1.7RE

The conclusion is that, there is linear relation between the number of male and female physicians.

Explanation of Solution

Given info:

The level of significance is α=0.01 and the sample size is 7.

Calculation:

The hypotheses are given below:

Null hypothesis:

H0:ρ=0

That is, there is no linear relation between the number of male physicians and number of female physicians.

Alternative hypothesis:

H1:ρ0

That is, there is a linear relation between the number of male physicians and number of female physicians.

The formula to obtain the degrees of the freedom is n2 .

That is,

n2=72=5

From the “TABLE –I: Critical Values for the PPMC”, the critical value for 5 degrees of freedom and α=0.01 level of significance is 0.875.

Rejection Rule:

If the absolute value of r is greater than the critical value then reject the null hypothesis.

Conclusion:

From part (b), the value of the correlation of Men and Women is 0.907. That is the absolute value of r is 0.907.

Here, the absolute value of r is greater than the critical value.

That is, |r|(=0.907)<critical value(=0.875) .

By the rejection rule, the null hypothesis is rejected.

Therefore, there is sufficient evidence to support the claim that “there is a linear relation between the number of male and female physicians”.

d.

To determine

To find: The regression equation for the given data

d.

Expert Solution
Check Mark

Answer to Problem 10.1.7RE

The regression equation for the given data is y^=103+3.41x .

Explanation of Solution

Calculation:

Regression:

Software procedure:

Step by step procedure to obtain the regression equation using the MINITAB software:

  • Choose Stat > Regression > Regression.
  • In Responses, enter the column of Female.
  • In Predictors, enter the column of Male.
  • Click OK.

Output using the MINITAB software is given below:

ELEMENTARY STATISTICS-TEXT (LL), Chapter 10, Problem 10.1.7RE , additional homework tip  3

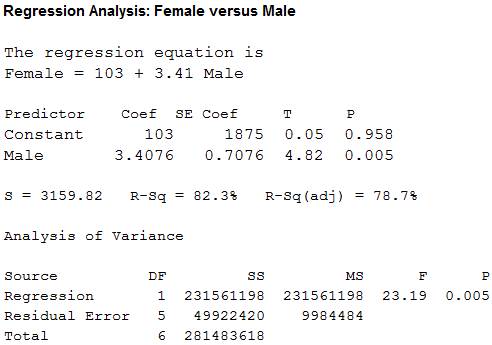
Thus, the regression equation for the given data is y^=103+3.41x .

e.

To determine

To construct: The regression line on the scatter plot if appropriate.

e.

Expert Solution
Check Mark

Answer to Problem 10.1.7RE

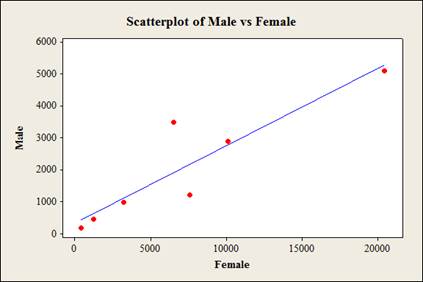
The regression line on the scatter plot the scatterplot is as follows,

ELEMENTARY STATISTICS-TEXT (LL), Chapter 10, Problem 10.1.7RE , additional homework tip  4

Explanation of Solution

Calculation:

Step by step procedure to obtain scatterplot using the MINITAB software:

  • Choose Graph > Scatterplot.
  • Choose With Regression and then click OK.
  • Under Y variables, enter a column of Male.
  • Under X variables, enter a column of Female.
  • Click OK.

f.

To determine

To predict: The number of male specialists when there are 2,000 female specialists.

f.

Expert Solution
Check Mark

Answer to Problem 10.1.7RE

The predicted value of number of male specialists when there are 2,000 female specialists is 6,923.

Explanation of Solution

From part (d), the regression equation for the given data is y^=103+3.41x .

Substitute x as 2,000 in the regression equation

y^=103+3.41x=103+(3.41×2,000)=103+6,820=6,923

Thus, the predicted value of number of male specialists when there are 2,000 female specialists is 6,923.

Want to see more full solutions like this?

Subscribe now to access step-by-step solutions to millions of textbook problems written by subject matter experts!

Chapter 10 Solutions

ELEMENTARY STATISTICS-TEXT (LL)

Ch. 10.1 - When two variables are correlated, can the...Ch. 10.1 - For Exercises 11 through 27, perform the following...Ch. 10.1 - Prob. 12ECh. 10.1 - Prob. 13ECh. 10.1 - For Exercises 11 through 27, perform the following...Ch. 10.1 - For Exercises 11 through 27, perform the following...Ch. 10.1 - For Exercises 11 through 27, perform the following...Ch. 10.1 - Prob. 17ECh. 10.1 - Prob. 18ECh. 10.1 - Prob. 19ECh. 10.1 - For Exercises 11 through 27, perform the following...Ch. 10.1 - For Exercises 11 through 27, perform the following...Ch. 10.1 - For Exercises 11 through 27, perform the following...Ch. 10.1 - Prob. 23ECh. 10.1 - For Exercises 11 through 27, perform the following...Ch. 10.1 - Prob. 25ECh. 10.1 - Prob. 26ECh. 10.1 - Prob. 27ECh. 10.1 - Prob. 28ECCh. 10.1 - Prob. 29ECCh. 10.1 - Prob. 30ECCh. 10.2 - Applying the Concepts 102 Stopping Distances...Ch. 10.2 - What two things should be done before one performs...Ch. 10.2 - What are the assumptions for regression analysis?Ch. 10.2 - Prob. 3ECh. 10.2 - What is the symbol for the slope? For the y...Ch. 10.2 - Prob. 5ECh. 10.2 - When all the points fall on the regression line,...Ch. 10.2 - What is the relationship between the sign of the...Ch. 10.2 - As the value of the correlation coefficient...Ch. 10.2 - Prob. 9ECh. 10.2 - When the value of r is not significant, what value...Ch. 10.2 - For Exercises 11 through 27, use the same data as...Ch. 10.2 - Prob. 12ECh. 10.2 - For Exercises 11 through 27, use the same data as...Ch. 10.2 - For Exercises 11 through 27, use the same data as...Ch. 10.2 - For Exercises 11 through 27, use the same data as...Ch. 10.2 - For Exercises 11 through 27, use the same data as...Ch. 10.2 - Prob. 17ECh. 10.2 - Prob. 18ECh. 10.2 - Prob. 19ECh. 10.2 - For Exercises 11 through 27, use the same data as...Ch. 10.2 - For Exercises 11 through 27, use the same data as...Ch. 10.2 - For Exercises 11 through 27, use the same data as...Ch. 10.2 - For Exercises 11 through 27, use the same data as...Ch. 10.2 - For Exercises 11 through 27, use the same data as...Ch. 10.2 - Prob. 25ECh. 10.2 - Prob. 26ECh. 10.2 - For Exercises 11 through 27, use the same data as...Ch. 10.2 - Prob. 28ECh. 10.2 - Prob. 29ECh. 10.2 - For Exercises 28 through 33, do a complete...Ch. 10.2 - For Exercises 28 through 33, do a complete...Ch. 10.2 - For Exercises 28 through 33, do a complete...Ch. 10.2 - Prob. 33ECh. 10.2 - For Exercises 34 and 35, do a complete regression...Ch. 10.2 - For Exercises 34 and 35, do a complete regression...Ch. 10.2 - For Exercises 13, 15, and 21 in Section 101, find...Ch. 10.2 - Prob. 37ECCh. 10.2 - The value of the correlation coefficient can also...Ch. 10.3 - Applying the Concepts 103 Interpreting Simple...Ch. 10.3 - What is meant by the explained variation? How is...Ch. 10.3 - What is meant by the unexplained variation? How is...Ch. 10.3 - What is meant by the total variation? How is it...Ch. 10.3 - Define the coefficient of determination.Ch. 10.3 - How is the coefficient of determination found?Ch. 10.3 - Define the coefficient of nondetermination.Ch. 10.3 - How is the coefficient of nondetermination found?Ch. 10.3 - Prob. 8ECh. 10.3 - Prob. 9ECh. 10.3 - Prob. 10ECh. 10.3 - Prob. 11ECh. 10.3 - Prob. 12ECh. 10.3 - Prob. 13ECh. 10.3 - Prob. 14ECh. 10.3 - Prob. 15ECh. 10.3 - Compute the standard error of the estimate for...Ch. 10.3 - Compute the standard error of the estimate for...Ch. 10.3 - Compute the standard error of the estimate for...Ch. 10.3 - Prob. 19ECh. 10.3 - For the data in Exercises 14 in Sections 101 and...Ch. 10.3 - Prob. 21ECh. 10.3 - Prob. 22ECh. 10.4 - Applying the Concepts 104 More Math Means More...Ch. 10.4 - Explain the similarities and differences between...Ch. 10.4 - What is the general form of the multiple...Ch. 10.4 - Prob. 3ECh. 10.4 - Prob. 4ECh. 10.4 - How do the values of the individual correlation...Ch. 10.4 - Age, GPA, and Income A researcher has determined...Ch. 10.4 - Prob. 7ECh. 10.4 - Prob. 8ECh. 10.4 - Aspects of Students Academic Behavior A college...Ch. 10.4 - Age, Cholesterol, and Sodium A medical researcher...Ch. 10.4 - Explain the meaning of the multiple correlation...Ch. 10.4 - What is the range of values R can assume?Ch. 10.4 - Prob. 13ECh. 10.4 - What are the hypotheses used to test the...Ch. 10.4 - What test is used to test the significance of R?Ch. 10.4 - What is the meaning of the adjusted R2? Why is it...Ch. 10 - Prob. 10.1.1RECh. 10 - For Exercises 1 through 7, do a complete...Ch. 10 - Prob. 10.1.3RECh. 10 - For Exercises 1 through 7, do a complete...Ch. 10 - For Exercises 1 through 7, do a complete...Ch. 10 - For Exercises 1 through 7, do a complete...Ch. 10 - Prob. 10.1.7RECh. 10 - For Exercise 4, find the standard error of the...Ch. 10 - Prob. 10.2.9RECh. 10 - Prob. 10.2.10RECh. 10 - Prob. 10.2.11RECh. 10 - Prob. 10.2.12RECh. 10 - (Opt.) A study found a significant relationship...Ch. 10 - Prob. 10.2.14RECh. 10 - Prob. 10.2.15RECh. 10 - Prob. 1DACh. 10 - Prob. 2DACh. 10 - Prob. 3DACh. 10 - Prob. 1CQCh. 10 - Determine whether each statement is true or false....Ch. 10 - Determine whether each statement is true or false....Ch. 10 - Determine whether each statement is true or false....Ch. 10 - Determine whether each statement is true or false....Ch. 10 - Determine whether each statement is true or false....Ch. 10 - Prob. 7CQCh. 10 - Select the best answer. 8. To test the...Ch. 10 - Select the best answer. 9. The test of...Ch. 10 - Prob. 10CQCh. 10 - Prob. 11CQCh. 10 - Prob. 12CQCh. 10 - Complete the following statements with the best...Ch. 10 - Prob. 14CQCh. 10 - Prob. 15CQCh. 10 - Prob. 16CQCh. 10 - Prob. 17CQCh. 10 - Prob. 18CQCh. 10 - Prob. 19CQCh. 10 - Prob. 20CQCh. 10 - Prob. 21CQCh. 10 - Prob. 22CQCh. 10 - Prob. 23CQCh. 10 - For Exercise 20, find the 90% prediction interval...Ch. 10 - Prob. 25CQCh. 10 - Prob. 26CQCh. 10 - (Opt.) Find R when ryx1 = 0.561 and ryx2 = 0.714...Ch. 10 - Prob. 28CQCh. 10 - Prob. 1CTCCh. 10 - Prob. 2CTCCh. 10 - Prob. 3CTCCh. 10 - Prob. 4CTCCh. 10 - Product Sales When the points in a scatter plot...Ch. 10 - Prob. 6CTCCh. 10 - Prob. 7CTCCh. 10 - Product Sales When the points in a scatter plot...Ch. 10 - Prob. 9CTC
Knowledge Booster
Background pattern image
Recommended textbooks for you
Text book image
MATLAB: An Introduction with Applications
Statistics
ISBN:9781119256830
Author:Amos Gilat
Publisher:John Wiley & Sons Inc
Text book image
Probability and Statistics for Engineering and th...
Statistics
ISBN:9781305251809
Author:Jay L. Devore
Publisher:Cengage Learning
Text book image
Statistics for The Behavioral Sciences (MindTap C...
Statistics
ISBN:9781305504912
Author:Frederick J Gravetter, Larry B. Wallnau
Publisher:Cengage Learning
Text book image
Elementary Statistics: Picturing the World (7th E...
Statistics
ISBN:9780134683416
Author:Ron Larson, Betsy Farber
Publisher:PEARSON
Text book image
The Basic Practice of Statistics
Statistics
ISBN:9781319042578
Author:David S. Moore, William I. Notz, Michael A. Fligner
Publisher:W. H. Freeman
Text book image
Introduction to the Practice of Statistics
Statistics
ISBN:9781319013387
Author:David S. Moore, George P. McCabe, Bruce A. Craig
Publisher:W. H. Freeman