
Concept explainers
Videos
A random sample of 250 observations was classified according to the row and column categories shown in the table below.

a. Do the data provide sufficient evidence to conclude that the rows and columns are dependent? Test using α = .05.
b. Would the analysis change if the row totals were fixed before the data were collected?
c. Do the assumptions required for the analysis to be valid differ according to whether the row (or column) totals are fixed? Explain.
d. Convert the table entries to percentages by using each column total as a base and calculating each row response as a percentage of the corresponding column total. In addition, calculate the row totals and convert them to percentages of all 250 observations.
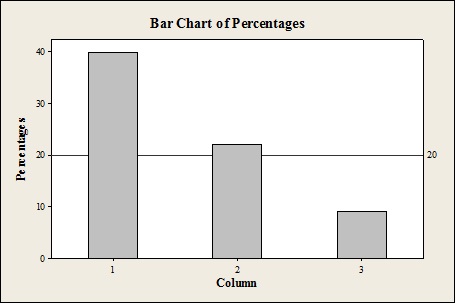
e. Create a bar graph with row 1 percentage on the vertical axis against the column number on the horizontal axis. Draw horizontal lines corresponding to the row 1 percentages. Does the graph support the result of the test conducted in part a?
a.
Answer to Problem 10.40LM
There is enough evidence to conclude that the rows and columns are dependent.
Explanation of Solution
Calculation:
The claim is to test whether the rows and columns are dependent. If the claim is rejected, then there is enough evidence to conclude that the rows and columns are independent.
The null hypothesis for testing the testing the independence of rows and columns are independent is,
Alternative hypothesis:
For checking the relationship between two variables, the chi-square test for independence is used.
The chi-square test statistics is,
The expected values can be obtained as follows:
The test statistic can be obtained as follows:
Thus the value of test statistic is 54.14.
Degrees of freedom:
The degrees of freedom for the test statistic is,.
Thus, the degrees of freedom for the test is 4.
Critical value:
The level of significance is given as
Use Table IV, Appendix D to find the critical values.
Procedure:
- Locate 4 in the column of degrees of freedom in the Table IV.
- Take the value corresponding to
From the table the critical value is
Thus, the rejection region is
Rejection Rule:
If
Conclusion:
The chi square test statistic is 54.14 and the critical value is 9.48773.
The chi square test statistic is greater than the critical value.
That is,
Therefore, the null hypothesis is rejected.
Thus, there is enough evidence to conclude that rows and columns are dependent at
b.
To check: Whether the analysis change if the row totals were fixed before the data were collected.
Answer to Problem 10.40LM
No. If the row totals were fixed before the data were collected then there will be no change in the analysis.
Explanation of Solution
Justification:
Here the row totals were fixed before the data were collected then the analysis remains identical.
c.
To explain: Whether the assumptions required for the analysis to be valid differ according to whether the row ( or column) totals are fixed.
Answer to Problem 10.40LM
Yes, the assumptions required for the analysis to be valid differ according to whether the row (or column) totals are fixed.
Explanation of Solution
If the row and column totals are not fixed then the random samples are taken from a multinomial distribution. If the row totals are fixed then the samples of size k are taken from k multinomial population.
d.
To convert: The table entries to percentages by using each column total as a base and calculating each row response as a percentage of the corresponding column total.
To calculate: The row totals and convert them to percentages of all 250 observations.
Answer to Problem 10.40LM
The percentages in a table is as follows:
| Column | Totals | ||||
| 1 | 2 | 3 | |||
| Rows | 1 |
|
|
|
|
| 2 |
|
|
|
| |
| 3 |
|
|
|
| |
Explanation of Solution
Given info:
A
Justification:
To get the percentage corresponding to each frequency first divide the numbers in each column by the column total and then multiply by 100. Also, divide the row totals by the overall total and then multiply by 100.
Percentage of the (1,1) cell
The percentage of (1,1 )cell can be obtained as follows:
Substitute 20 for “frequency of the cell” and 50 for “ column total” in the above equation.
The required percentage value is,
Thus the percentage corresponding to cell (1,1) is 40%.
Similarly percentage corresponding other cell can be obtained as shown in the following table:
| Column | Totals | ||||
| 1 | 2 | 3 | |||
| Rows | 1 |
|
|
|
|
| 2 |
|
|
|
| |
| 3 |
|
|
|
| |
e.
To create: A bar graph with row 1 percentage on the vertical axis and column number on the horizontal axis.
To show: The row 1 total percentage as a horizontal lie on the graph.
To check: The graph support the result of the test conducted in part a.
Answer to Problem 10.40LM
Output using the MINITAB software is given below:
The graph support the result of the test conducted in part a.
Explanation of Solution
Calculation:
The row 1 total percentage can be obtained as follows:
Bar graph:
Software procedure:
Step by step procedure to obtain the test statistic using the MINITAB software:
- Choose Graph > Bar Chart.
- From Bars represent, choose Values from a table.
- Choose Simple. Click OK.
- In Graph variables, enter the column of Column.
- In Categorical, enter the column of Percentages.
- Click OK.
Interpretation:
The bar chart is constructed by taking the columns of row 1 along horizontal axis and its corresponding percentage along vertical axis. The reference line is marked at 20%.
Conclusion:
If the rows and columns are independent then the row percentage in each column should close to the row total percentages. Here the row percentage in each column is not close to the row total percentages. Thus it implies that the row and column are not independent.
The plot supports the decision in part a.
Want to see more full solutions like this?
Chapter 10 Solutions
EBK STATISTICS FOR BUSINESS AND ECONOMI
Additional Business Textbook Solutions
Intro Stats, Books a la Carte Edition (5th Edition)
An Introduction to Mathematical Statistics and Its Applications (6th Edition)
Statistical Reasoning for Everyday Life (5th Edition)
STATS:DATA+MODELS-W/DVD
Elementary Statistics: Picturing the World (7th Edition)


- Is it possible for an econometric study to have internal validity but notexternal validity?arrow_forwardWhich of the following is a reason for using independently pooled cross sections? a. To increase the sample size b. To select a sample based on the dependent variable c. To select a sample based on the independent variable d. To obtain data on different cross sectional unitsarrow_forwardAccording to the following Dicky-Fuller tests, would you conclude that the series tb3, is stationary at the 10% significance level? dfuller tb3 Dickey-Fuller test for unit root z(t) Number of obs = 348 Interpolated Dickey-Fuller Test Statistic 1% Critical Value 5% Critical 10% Critical Value Value -2.738 -3.452 -2.876 -2.570 MacKinnon approximate p-value for 2(t) = 0.0677 dfuller tb3, drift Dickey-Fuller test for unit root z(t) Test Statistic -2.738 p-value for 2(t) = 0.0033 Number of obs 348 2(t) has t-distribution 1% Critical Value 5% Critical Value 10% Critical Value -2.337 -1.649 -1.284 Select one: Both tables suggest that the series tb3 is stationary b. Both tables suggest that the series tb3 is non-stationary C. The table at the top suggest that the series tb3 is not-stationary, but the other suggest is stationary d. The table at the top suggest that the series tb3 is stationary, but the other suggest is not-stationaryarrow_forward
- What sampling technique is used? In a research class of 40 students, the teacher divides the class into five groups, each with eight members per group. The teacher then asked the class to choose their group members based on interests, compatibility, and rapport. After the selection was made, the teacher realized that the abilities per group were uneven. He then reshuffled some members of the group to achieve equilibrium among the groups. The teacher needs ten students to represent each group. He selected one male and one female from each group based on academic performance, leadership skills, and social skills as qualities that will embody as representatives per group.arrow_forwardWe are interested in analysing the effect of the lockout laws introduced in some areas of the Sydney CBD and nearby surrounds on the number of alcohol-related violent incidents. Suppose we have two samples of data on the number of violent incidents in a number of local areas of the Sydney CBD and nearby surrounds. Pubs, hotels and clubs located in a subset of these areas became subject to the lockout laws when they were introduced in 2014. The first sample is from 2010 before the introduction of the lockout laws, and the second is from 2015 after the introduction of the law. The hypothesis we wish to test is that the introduction of the lockout laws reduces violent incidents in the areas in which the lockout laws were put in place. We use a difference-in-difference model on the pooled data from 2010 and 2015. We find the following results: viol_inc hat = 33.21 (5.29) + 12.43lockout (7.01) – 4.19Yr2015 (2.98) – 3.32 (lockout x Yr2015) (1.85) N = 181, R^2 = 0.128 Where: viol_incis the…arrow_forward10. Student A in our class ECON 2210 tried to estimate the average marks of the midterm held in March, 2022. Based on a random sample of 30 students' marks and with a 95% confidence level, the student arrived at an interval estimate for the average marks of between 50 and 80. (a) After receiving this result, student B in the same class claimed that there was a 95% chance that the true average marks of the midterm were between 50 and 80. How would you respond to this statement? Is it correct? Why or why not? (b) Student C in the same class did not agree with student B and he claimed that there was a 95% chance that the true average marks of the next midterm were between 50 and 80. How would you respond to this statement? Is it correct? Why or why not?arrow_forward
- A manufacturer of cat food was planning to survey households in the US to determine purchasing habits of cat owners. Among the questions to be included are those that relate to Where cat fat is primarily purchased. Whether dry or moist cat food is purchased. The number of cats living in the household. Whether the cat is pedigreed. Describe the population. For each of the four items listed, indicate whether the variable is categorical or numerical.arrow_forwardA group of health professionals produced a cholesterol drug. To measure the effectiveness of this drug they implemented a program that offered free drugs to people to decrease their cholesterol level. Health professionals also collected a sample of people, who did not have the drug, to act as a control group. Health professionals then measured cholesterol level of all individuals in year 1, before any cholesterol drug were given out, and then measured the same group of individuals again in year 2 after the cholesterol drugs had been administered. Consider the following model to evaluate the effectiveness of the drug on people's cholesterol level: cholie = Bo + 8od2, + B1drugit + Vịt chol= cholestrol of individual i, in year t d2;= binary variable equal to 1 if the time period is year 2, and 0 otherwise drug= binary variable equal to 1 if individual i took the drug in year t, and 0 otherwise V= composite error consisting of the unobserved, time-constant effect (a;) and the idiosyncratic…arrow_forwardQuestion 2 In the past, 15% of the mail order solicitations for a certain charity resulted in a financial contribution. A new solicitation letter that has been drafted is sent to a sample of 200 people and 45 responded with a contribution. At the .05 significance level can it be concluded that the new letter is more effective?arrow_forward
- Hotel Prices. Hotel room pricing changes over time (Lodging Magazine), but is there a difference between Europe hotel prices and U.S. hotel prices? The file IntHotels contains changes in the hotel prices for 47 major European cities and 53 major U.S. cities. a On the basis of the sample results, can we conclude that the mean change in hotel rates in Europe and the United States are different? Develop appropriate null and alternative hypotheses. b Use a.01. What is your conclusion?arrow_forwardIn a study aimed at creating reference values, abdominal circumference (measured in cm) was measured in adult men. It was found that the relationship to age could be described as abdominal circumference = 82 + 0.3 x age a) What is the analysis that produces such a formula called? b) At what age is the average abdominal circumference 100 cm?arrow_forwardConsider the following competing hypotheses and accompanying sample data. (You may find it useful table: z table or ttable) Ho: P1 P2 ≥ 0 HA: P1 P2 < 0 x1 = 223 n1 = 418 x2 = 245 n2 = 418 Test statistic reference the appropriate a. Calculate the value of the test statistic. (Negative value should be indicated by a minus sign. Round final answer to 2 decimal places.)arrow_forward

 Principles of Economics (12th Edition)EconomicsISBN:9780134078779Author:Karl E. Case, Ray C. Fair, Sharon E. OsterPublisher:PEARSON
 Engineering Economy (17th Edition)EconomicsISBN:9780134870069Author:William G. Sullivan, Elin M. Wicks, C. Patrick KoellingPublisher:PEARSON
 Principles of Economics (MindTap Course List)EconomicsISBN:9781305585126Author:N. Gregory MankiwPublisher:Cengage Learning
 Managerial Economics: A Problem Solving ApproachEconomicsISBN:9781337106665Author:Luke M. Froeb, Brian T. McCann, Michael R. Ward, Mike ShorPublisher:Cengage Learning
 Managerial Economics & Business Strategy (Mcgraw-...EconomicsISBN:9781259290619Author:Michael Baye, Jeff PrincePublisher:McGraw-Hill Education