
(a)
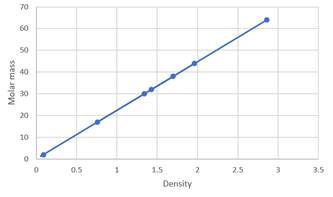
Interpretation: The given data needs to be plotted if the density is plotted on the x-axis.
Concept Introduction: The molar mass and density of gases are directly proportional to each other.
(a)
Explanation of Solution
The given table for data showing the molar mass and density of seven gases at STP is as follows:
| Substance | Molar mass (g/mol) | Density (g/L) |
| Oxygen | 32 | 1.43 |
| Carbon dioxide | 44 | 1.96 |
| Ethane | 30 | 1.34 |
| Hydrogen | 2 | 0.089 |
| Sulfur dioxide | 64.1 | 2.86 |
| Ammonia | 17 | 0.759 |
| Fluorine | 38 | 1.70 |
Plotting graph by putting density at x -axis. Thus, the graph obtained will be:
(b)
Interpretation: The slope of the straight-line plot needs to be determined.
Concept Introduction: The slope of the straight line can be determined by simply finding the equation of a straight-line graph. To determine the value of the slope, display the equation on a graph.
(b)
Explanation of Solution
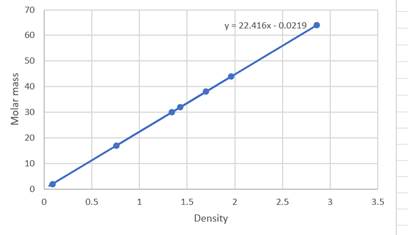
The equation for the graph is
On comparing the slope of the graph is 22.416.
(c)
Interpretation: The molar mass of a gas at STP with a density of 1.10 g/L needs to be determined.
Concept Introduction: The slope of the straight line can be determined by simply finding the equation of a straight-line graph. To determine the value of the slope, display the equation on a graph.
(c)
Explanation of Solution
The graph equation is as follows:
Since density is plotted on the x -axis put the value to calculate y which is the molar mass of gas corresponding to that volume.
Therefore, the molar mass of the gas is
(d)
Interpretation The number of moles of a gas at STP needs to be calculated for mass 56.0 g.
Concept Introduction: The slope of the straight line can be determined by simply finding the equation of a straight-line graph. To determine the value of the slope, display the equation on a graph.
(d)
Explanation of Solution
According to the question, the number of moles of a gas is 1 mol at STP with a mass of 56.0 g. Thus, the molar mass is 56 g/mol.
The graph equation is as follows:
Since density is plotted on the x -axis. Thus, the molar mass is at the y-axis.
Therefore, the molar mass of the gas is 25 g/L.
Chapter 10 Solutions
Chemistry 2012 Student Edition (hard Cover) Grade 11

 ChemistryChemistryISBN:9781305957404Author:Steven S. Zumdahl, Susan A. Zumdahl, Donald J. DeCostePublisher:Cengage Learning
 ChemistryChemistryISBN:9781259911156Author:Raymond Chang Dr., Jason Overby ProfessorPublisher:McGraw-Hill Education
 Principles of Instrumental AnalysisChemistryISBN:9781305577213Author:Douglas A. Skoog, F. James Holler, Stanley R. CrouchPublisher:Cengage Learning
 Organic ChemistryChemistryISBN:9780078021558Author:Janice Gorzynski Smith Dr.Publisher:McGraw-Hill Education
 Chemistry: Principles and ReactionsChemistryISBN:9781305079373Author:William L. Masterton, Cecile N. HurleyPublisher:Cengage Learning
 Elementary Principles of Chemical Processes, Bind...ChemistryISBN:9781118431221Author:Richard M. Felder, Ronald W. Rousseau, Lisa G. BullardPublisher:WILEY