
Videos
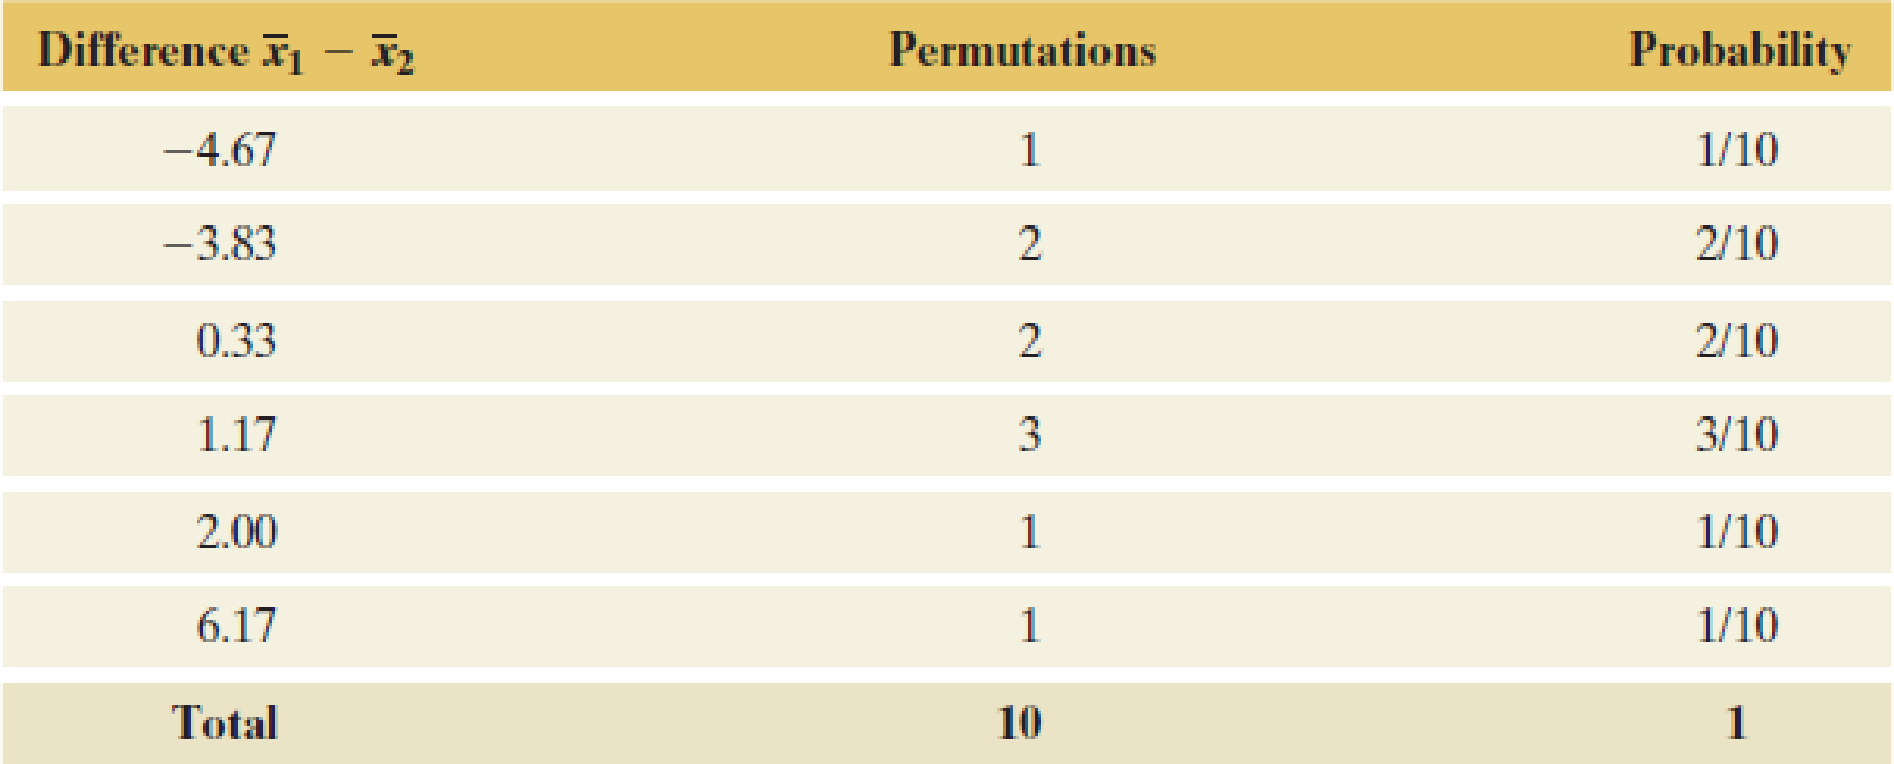
Table 10.13 Sampling Distribution of
The table shows each possible difference, how often it occurs among the 10 permutations, and the probability of observing this difference under the null hypothesis.
Want to see the full answer?
Check out a sample textbook solution
Chapter 10 Solutions
EP STATISTICS:ART+SCI...-MYLABSTATISTIC


 Calculus For The Life SciencesCalculusISBN:9780321964038Author:GREENWELL, Raymond N., RITCHEY, Nathan P., Lial, Margaret L.Publisher:Pearson Addison Wesley,
 Big Ideas Math A Bridge To Success Algebra 1: Stu...AlgebraISBN:9781680331141Author:HOUGHTON MIFFLIN HARCOURTPublisher:Houghton Mifflin Harcourt
 Glencoe Algebra 1, Student Edition, 9780079039897...AlgebraISBN:9780079039897Author:CarterPublisher:McGraw Hill
 College Algebra (MindTap Course List)AlgebraISBN:9781305652231Author:R. David Gustafson, Jeff HughesPublisher:Cengage Learning