
if the event would cause a moment along or a shift in the position of the long run
Concept introduction:
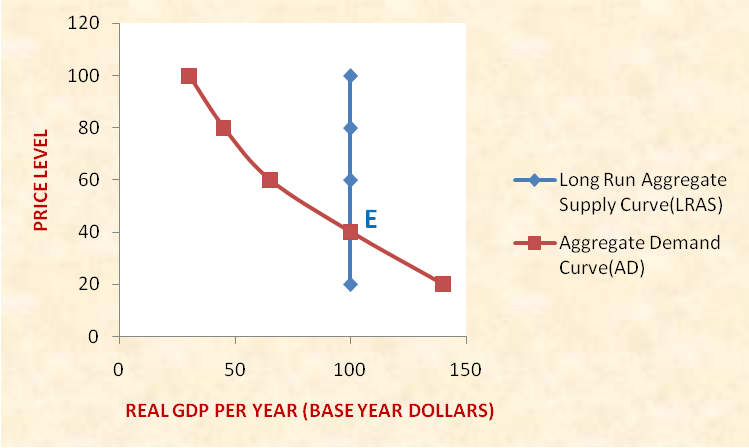
Aggregate Demand Curve (AD) Curve- The aggregate demand is a macro perspective of the individual demand analysis. It is a quantitative aggregate of the individual demand for goods and services in the economy. In other words, it is the total quantity of all goods and services demanded by the economy at different price levels. Like the individual demand curve, the aggregate demand curve is a downward sloping curve implying an inverse relationship between the quantity demanded and price. Graphically, the curve is drawn on a two-dimensional frame where price level is measured on Y-axis and the real quantity of the goods and services purchased as measured by the Real GDP is measured on X-axis.
Aggregate Supply Curve (AC) Curve- The aggregate supply curve is the quantity of real GDP supplied by the economy at different price levels. It is a quantitative aggregate of the quantity of goods and services supplied by the producers in the economy at varying price levels.
Short run ASC (SRAS) Curve- The relationship between the quantity of the real GDP supplied by the economy at different price levels in a period when the all factors of production are not variable and increased prices do not culminate into increased input prices, is represented by the Short Run ASC or SRAS Curve. This is a
Long Run Aggregate Supply Curve (LRAS) Curve- In the long run with all factors variable, the increased price level translates into higher cost of living and higher input prices. The producers adjust the production levels to meet the increased cost of production. Thus, in the long run, the supply does not change in reaction to changes in the aggregate demand. This long run relationship between the Aggregate supply and price level is the Long Run Aggregate Supply (LRAS) Curve and is graphically represented as a straight line parallel to the Y-Axis implying perfect inelasticity of supply.
Long Run Equilibrium and the AS-AD Model- The point of intersection of the SRAS Curve, the LRAS Curve and the AD Curve is studied under the AS-AD Model and depicts the long run equilibrium in the economy.
The figure below depicts an economy in a state of long run equilibrium at Point E where LRAS curve equals the AD curve.
Want to see the full answer?
Check out a sample textbook solution
Chapter 10 Solutions
Economics Today: Macro View (Looseleaf)


 Principles of Economics (12th Edition)EconomicsISBN:9780134078779Author:Karl E. Case, Ray C. Fair, Sharon E. OsterPublisher:PEARSON
 Engineering Economy (17th Edition)EconomicsISBN:9780134870069Author:William G. Sullivan, Elin M. Wicks, C. Patrick KoellingPublisher:PEARSON
 Principles of Economics (MindTap Course List)EconomicsISBN:9781305585126Author:N. Gregory MankiwPublisher:Cengage Learning
 Managerial Economics: A Problem Solving ApproachEconomicsISBN:9781337106665Author:Luke M. Froeb, Brian T. McCann, Michael R. Ward, Mike ShorPublisher:Cengage Learning
 Managerial Economics & Business Strategy (Mcgraw-...EconomicsISBN:9781259290619Author:Michael Baye, Jeff PrincePublisher:McGraw-Hill Education