Videos
In Exercises 1–3, use the following service times (in seconds) observed at lunchtime at different fast-food restaurant drive-up windows. Assume that the service times for such restaurants are
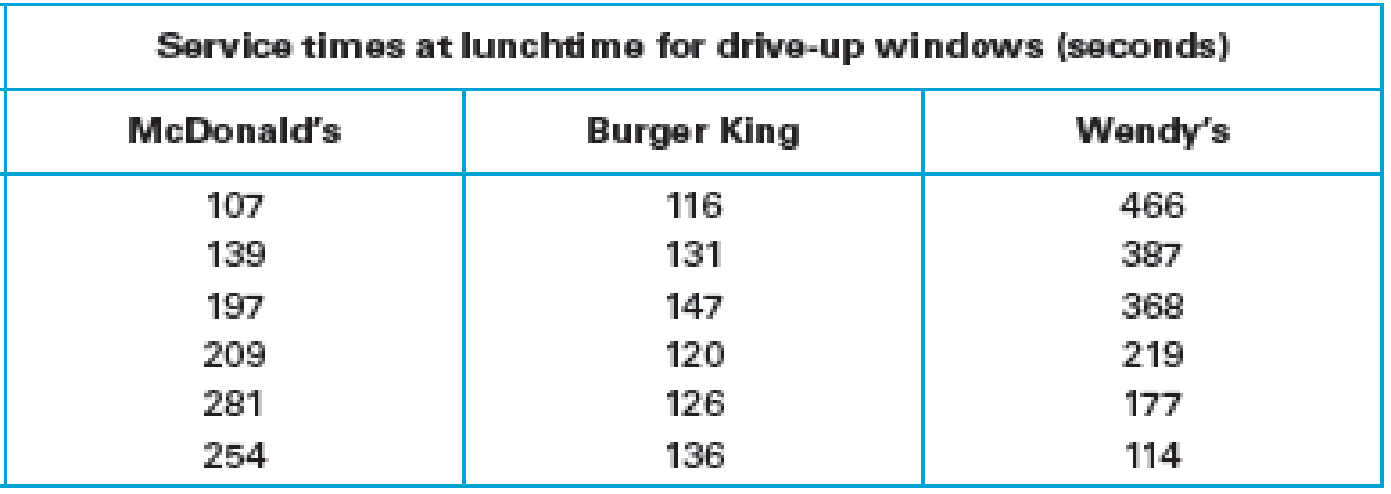
- 1. McDonald’s. Using only the service times from McDonald’s, construct a 95% confidence
interval estimate of the populationmean .
Using the service times from McDonald’s obtain a 95% confidence interval to estimate the populations mean.
Answer to Problem 1CRE
The 95% confidence interval to estimate the population mean is
Explanation of Solution
Calculation:
The data related to the service times at lunchtime for drive-up windows at McDonald’s.
t-distribution:
A random variable X is said to follow t distribution with degrees of freedom
The value of random variable X can be defined as,
Test statistic:
The test statistic is obtained as,
Level of significance:
The level of significance is
For two tail test the level of significance is,
The sample size is
Degrees of freedom:
The degrees of freedom for t distribution is
Hence, the degrees of freedom for
Critical value:
Step by step procedure to obtain the critical value from the TABLE 10.1: Critical t values, is obtained as:
- Locate the degrees of freedom of 5 from the 1st column of TABLE 10.1.
- Locate the area from the column of “0.05 area in two tails” corresponding to the degrees of freedom of 5.
The critical value is 2.571.
Mean:
Software procedure:
Step by step procedure using EXCEL to obtain Mean is given below:
- Enter the name McDonald’s in the first cell A1 of an EXCEL sheet.
- Enter the data value in that sheet corresponding to the heading McDonald’s from cell A2 to A7.
- In cell A8 enter the formula “=AVERAGE(A2:A7)”.
- Click Enter.
The output is given below:

Thus, the sample mean
Standard deviation:
Software procedure:
Step by step procedure using EXCEL to obtain Standard deviation is given below:
- Enter the name McDonald’s in the first cell A1 of an EXCEL sheet.
- Enter the data value in that sheet corresponding to the heading McDonald’s from cell A2 to A7.
- In cell A8 enter the formula “=STDEVA(A2:A7)”.
- Click Enter.
The output is given below:

Thus, the sample standard deviation
Margin of error:
The margin of error, E is defined as,
The critical value is obtained as 2.571, the sample standard deviation is
Thus, the margin of error is,
Therefore, the margin of error is approximately 69.46
Confidence interval:
The 95% confidence interval around a sample mean to estimate the true value of population mean,
Hence the confidence interval is,
Thus, the 95% confidence interval to estimate the population mean is
Want to see more full solutions like this?
Chapter 10 Solutions
Statistical Reasoning for Everyday Life Plus NEW MyLab Statistics with Pearson eText -- Title-Specific Access Card Package (5th Edition) (Bennett Science & Math Titles)


 MATLAB: An Introduction with ApplicationsStatisticsISBN:9781119256830Author:Amos GilatPublisher:John Wiley & Sons Inc
 Probability and Statistics for Engineering and th...StatisticsISBN:9781305251809Author:Jay L. DevorePublisher:Cengage Learning
 Statistics for The Behavioral Sciences (MindTap C...StatisticsISBN:9781305504912Author:Frederick J Gravetter, Larry B. WallnauPublisher:Cengage Learning
 Elementary Statistics: Picturing the World (7th E...StatisticsISBN:9780134683416Author:Ron Larson, Betsy FarberPublisher:PEARSON
 The Basic Practice of StatisticsStatisticsISBN:9781319042578Author:David S. Moore, William I. Notz, Michael A. FlignerPublisher:W. H. Freeman
 Introduction to the Practice of StatisticsStatisticsISBN:9781319013387Author:David S. Moore, George P. McCabe, Bruce A. CraigPublisher:W. H. Freeman