
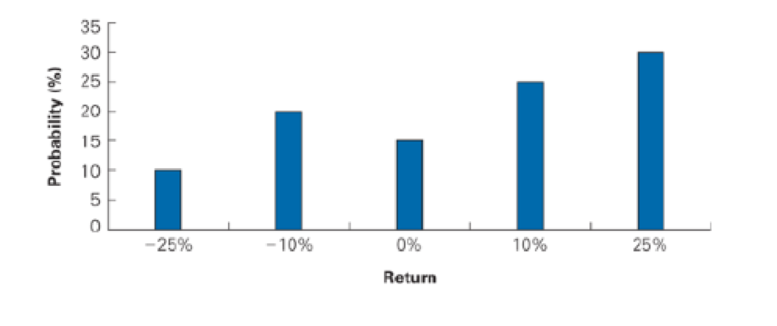
The figure on page informalfigure shows the one-year return distribution for RCS stock. Calculate
- a. The expected return.
- b. The standard deviation of the return.
a)
To determine: The expected return.
Introduction:
Expected return refers to a return that the investors expect on a risky investment in the future.
Answer to Problem 1P
The expected return is 5.5 percent.
Explanation of Solution
Given information:
The probability of a stock is 10% and the stock return is -25%, probability of another stock is 20% and its return is -10%, the probability of a stock is 25% and the stock return is 10%, and probability of a stock is 30% and the stock return is 25%.
The formula to calculate the expected return on the stock:
Compute the expected return:
Hence, the expected return is 5.5 percent.
b)
To determine: The standard deviation of the return.
Introduction:
Standard deviation refers to the variation in the actual returns from the expected returns.
Variance refers to the average difference of squared deviations of the actual data from the mean or average
Answer to Problem 1P
The standard deviation of the return is 16.13%.
Explanation of Solution
Given information:
The probability of a stock is 10% and the stock return is -25%, probability of another stock is 20% and its return is -10%, the probability of a stock is 25% and the stock return is 10%, and probability of a stock is 30% and the stock return is 25%.
The formula to calculate the standard deviation:
Calculate the standard deviation:
Hence, the standard deviation of the return is 16.13%.
Want to see more full solutions like this?
Chapter 10 Solutions
Corporate Finance: The Core (4th Edition) (Berk, DeMarzo & Harford, The Corporate Finance Series)
Additional Business Textbook Solutions
Gitman: Principl Manageri Finance_15 (15th Edition) (What's New in Finance)
Foundations of Finance (9th Edition) (Pearson Series in Finance)
Principles of Managerial Finance (14th Edition) (Pearson Series in Finance)
Foundations Of Finance
Corporate Finance
Financial Accounting (12th Edition) (What's New in Accounting)

- The following table reports the percentage of stocks in a portfolio for nine quarters: a. Construct a time series plot. What type of pattern exists in the data? b. Use trial and error to find a value of the exponential smoothing coefficient that results in a relatively small MSE. c. Using the exponential smoothing model you developed in part (b), what is the forecast of the percentage of stocks in a typical portfolio for the second quarter of year 3?arrow_forwardAn analyst gathered daily stock returns for Feburary 1 through March 31, calculated the Fama-French factors for each day in the sample (SMBt and HMLt), and estimated the Fama-French regression model shown in Equation 6-21. The estimated coefficients were ai = 0, bi = 1.2, ci = 0.4, and di = 1.3. On April 1, the market return was 10%, the return on the SMB portfolio (rSMB) was 3.2%, and the return on the HML portfolio (rHML) was 4.8%. Using the estimated model, what was the stocks predicted return for April 1?arrow_forwardThe standard deviation of stock returns for Stock A is 40%. The standard deviation of the market return is 20%. If the correlation between Stock A and the market is 0.70, then what is Stock A’s beta?arrow_forward
- An analyst has modeled the stock of a company using the Fama-French three-factor model. The market return is 10%, the return on the SMB portfolio (rSMB) is 3.2%, and the return on the HML portfolio (rHML) is 4.8%. If ai = 0, bi = 1.2, ci = 20.4, and di = 1.3, what is the stock’s predicted return?arrow_forwardWhat is the stand-alone risk? Use the scenario data to calculate the standard deviation of the bonds return for the next year.arrow_forward
 Intermediate Financial Management (MindTap Course...FinanceISBN:9781337395083Author:Eugene F. Brigham, Phillip R. DavesPublisher:Cengage Learning
 EBK CONTEMPORARY FINANCIAL MANAGEMENTFinanceISBN:9781337514835Author:MOYERPublisher:CENGAGE LEARNING - CONSIGNMENT

 Essentials of Business Analytics (MindTap Course ...StatisticsISBN:9781305627734Author:Jeffrey D. Camm, James J. Cochran, Michael J. Fry, Jeffrey W. Ohlmann, David R. AndersonPublisher:Cengage Learning