Concept explainers
a)
To determine: The mean of each sample.
a)
Answer to Problem 20P
Explanation of Solution
Given information:
| Sample | |||
| 1 | 2 | 3 | 4 |
| 4.5 | 4.6 | 4.5 | 4.7 |
| 4.2 | 4.5 | 4.6 | 4.6 |
| 4.2 | 4.4 | 4.4 | 4.8 |
| 4.3 | 4.7 | 4.4 | 4.5 |
| 4.3 | 4.3 | 4.6 | 4.9 |
Calculation of mean of each sample:
| Sample | ||||
| Sl. No. | 1 | 2 | 3 | 4 |
| 1 | 4.5 | 4.6 | 4.5 | 4.7 |
| 2 | 4.2 | 4.5 | 4.6 | 4.6 |
| 3 | 4.2 | 4.4 | 4.4 | 4.8 |
| 4 | 4.3 | 4.7 | 4.4 | 4.5 |
| 5 | 4.3 | 4.3 | 4.6 | 4.9 |
| Mean | 4.3 | 4.5 | 4.5 | 4.7 |
Table 1
Excel Worksheet:
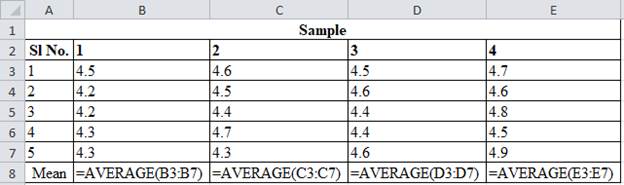
Sample 1:
The mean is calculated by adding each sample points. Adding the points 4.5, 4.2, 4.2, 4.3 and 4.3 and dividing by 5 gives mean of 4.3. The same process is followed for finding mean for other samples.
Hence, the mean of each sample is shown in Table 1
b)
To determine: The mean and standard deviation when the process parameters are unknown.
b)
Answer to Problem 20P
Explanation of Solution
Given information:
| Sample | |||
| 1 | 2 | 3 | 4 |
| 4.5 | 4.6 | 4.5 | 4.7 |
| 4.2 | 4.5 | 4.6 | 4.6 |
| 4.2 | 4.4 | 4.4 | 4.8 |
| 4.3 | 4.7 | 4.4 | 4.5 |
| 4.3 | 4.3 | 4.6 | 4.9 |
Calculation of mean and standard deviation:
Table 1 provides the mean for each sample points.
The mean is calculated by adding each mean of the samples. Adding the points 4.3, 4.5, 4.5 and 4.7 and dividing by 4 gives mean of 4.5.
The standard deviation is calculated using the above formula and substituting the values of mean in the above formula and the resultant of 0.192 is obtained.
Hence, the mean and standard deviation when the process parameters are unknown are 4.5 and 0.192.
c)
To determine: The mean and standard deviation of the sampling distribution.
c)
Answer to Problem 20P
Explanation of Solution
Given information:
| Sample | |||
| 1 | 2 | 3 | 4 |
| 4.5 | 4.6 | 4.5 | 4.7 |
| 4.2 | 4.5 | 4.6 | 4.6 |
| 4.2 | 4.4 | 4.4 | 4.8 |
| 4.3 | 4.7 | 4.4 | 4.5 |
| 4.3 | 4.3 | 4.6 | 4.9 |
Calculation of mean and standard deviation of the sampling distribution:
From calculation of mean of each samples, the mean for sampling distribution can be computed, the mean for sampling distribution is 4.5 (refer equation (1)).
The standard deviation of the sampling distribution is calculated by dividing 0.192 with the square root of 5 which gives the resultant as 0.086.
Hence, the mean and standard deviation of the sampling distribution is 4.5 and 0.086 respectively.
d)
To determine: The three-sigma control limit for the process and alpha risk provided by them.
d)
Answer to Problem 20P
Explanation of Solution
Given information:
| Sample | |||
| 1 | 2 | 3 | 4 |
| 4.5 | 4.6 | 4.5 | 4.7 |
| 4.2 | 4.5 | 4.6 | 4.6 |
| 4.2 | 4.4 | 4.4 | 4.8 |
| 4.3 | 4.7 | 4.4 | 4.5 |
| 4.3 | 4.3 | 4.6 | 4.9 |
Calculation of three-sigma control limit for the process:
The three-sigma control limits for the process is calculated by multiplying 3.00 with 0.086 (refer equation (2)) and the resultant is added with 4.5 to get an upper control limit which is 4.758 and subtracted to get lower control limit which is 4.242. Using z-factor table z = +3.00 corresponds to 0.4987.
The alpha risk is calculated to be as 0.0026.
Hence, the three-sigma control limits for the process are 4.758 and 4.242.
e)
To determine: The alpha risk for control limits of 4.14 and 4.86.
e)
Answer to Problem 20P
Explanation of Solution
Given information:
| Sample | |||
| 1 | 2 | 3 | 4 |
| 4.5 | 4.6 | 4.5 | 4.7 |
| 4.2 | 4.5 | 4.6 | 4.6 |
| 4.2 | 4.4 | 4.4 | 4.8 |
| 4.3 | 4.7 | 4.4 | 4.5 |
| 4.3 | 4.3 | 4.6 | 4.9 |
Formula:
Calculation alpha risk for control limits of 4.14 and 4.86:
The alpha risk is calculated by dividing the difference of 4.86 and 4.5 with 0.086 which gives +4.19 which is the risk is close to zero.
Hence, the alpha risk for control limits of 4.14 and 4.86 is +4.1
f)
To determine: Whether any of the sample means are beyond the control limits.
f)
Answer to Problem 20P
Explanation of Solution
Given information:
| Sample | |||
| 1 | 2 | 3 | 4 |
| 4.5 | 4.6 | 4.5 | 4.7 |
| 4.2 | 4.5 | 4.6 | 4.6 |
| 4.2 | 4.4 | 4.4 | 4.8 |
| 4.3 | 4.7 | 4.4 | 4.5 |
| 4.3 | 4.3 | 4.6 | 4.9 |
Determination of whether any of the sample means are beyond the control limits:
Table 1 provides the sample means for each sample. From observation, it can be found that each sample mean are within the control limit of 4.14 and 4.86. Therefore, each sample means lies within the control limits of 4.14 and 4.86.
Hence, there are no sample means which lies beyond the control limits.
g)
To determine: Whether any of the samples are beyond the control limits.
g)
Answer to Problem 20P
Explanation of Solution
Given information:
| SAMPLE | |||
| 1 | 2 | 3 | 4 |
| 4.5 | 4.6 | 4.5 | 4.7 |
| 4.2 | 4.5 | 4.6 | 4.6 |
| 4.2 | 4.4 | 4.4 | 4.8 |
| 4.3 | 4.7 | 4.4 | 4.5 |
| 4.3 | 4.3 | 4.6 | 4.9 |
Formula:
Mean Chart:
Range Chart:
Calculation of upper and lower control limits:
| SAMPLE | ||||
| 1 | 2 | 3 | 4 | |
| 4.5 | 4.6 | 4.5 | 4.7 | |
| 4.2 | 4.5 | 4.6 | 4.6 | |
| 4.2 | 4.4 | 4.4 | 4.8 | |
| 4.3 | 4.7 | 4.4 | 4.5 | |
| 4.3 | 4.3 | 4.6 | 4.9 | |
| Mean | 4.3 | 4.5 | 4.5 | 4.7 |
| Range | .3 | .4 | .2 | .4 |
From factors of three-sigma chart, A2 = 0.58; D3 = 0; D4 = 2.11.
Mean control chart:
Upper control limit:
The Upper control limit is calculated by adding the product of 0.58 and 0.325 with 4.5 which yields 4.689.
Lower control limit:
The Lower control limit is calculated by subtracting the product of 0.58 and 0.325 with 4.5 which yields 4.311.
The UCL and LCL for mean charts are 4.686 and 4.311. (4)
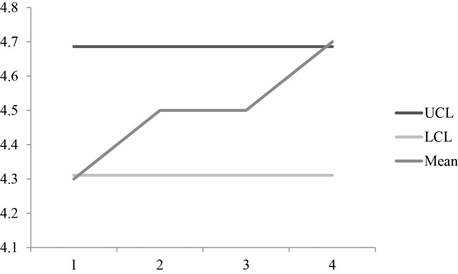
A graph is plotted using the UCL and LCL and mean values which shows the points are within the control limits.
Range control chart:
Upper control limit:
The Upper control limit is calculated by multiplying 2.11 with 0.325 which yields 0.686.
Lower control limit:
The lower control limit is calculated by multiplying 0 with 0.325 which yields 0.0.
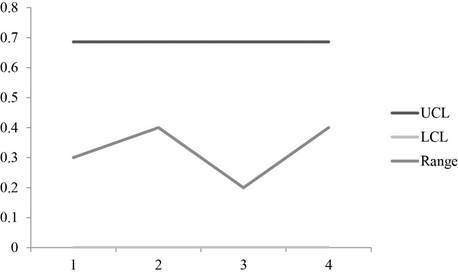
A graph is plotted using the UCL, LCL and Range values which shows that the points are within the control region.
Hence, all points are within control limits.
h)
To explain: The reason for variations in control limits.
h)
Answer to Problem 20P
Explanation of Solution
Reason for variations in control limits:
The control limits vary because in equation (3) and (4) because of the use of different measure for dispersion to measure the standard deviation and range.
Hence, the difference arises due to the use of different measures for dispersion to the measure the standard deviation and range.
i)
To determine: The control limits for the process and whether the process will be in control.
i)
Answer to Problem 20P
Explanation of Solution
Given information:
Determination of control limits of the process:
Sample mean is given in Table 1.
To calculate the control limits 0.18 is divided by root of 5 and is multiplied by 3 and the resultant is added to 4.4 to give UCL which is 4.641 and subtracted from 4.4 to get the LCL which is 4.159.
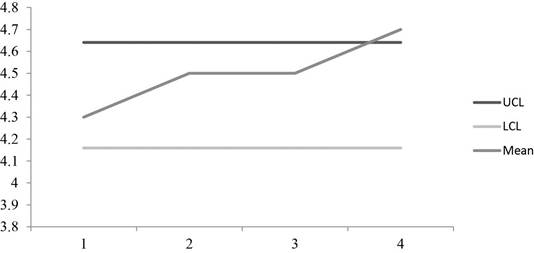
The graph shows that the some of the points are above the control limits which make the process to be out of control.
Hence, the process is out of control with UCL=4.641 and LCL=4.159.
Want to see more full solutions like this?
Chapter 10 Solutions
Operations Management (McGraw-Hill Series in Operations and Decision Sciences)


- A Quality Analyst wants to construct a control chart for determining whether three machines, all producing the same product, are under control with regard to a particular quality variable. Accordingly, he sampled four units of output from each machine, with the following results : Machine #1 measurements [14, 13, 24, 22]; Machine #2 measurements [ 14, 19, 23, 14]; Machine #3 measurements [ 14, 16, 13, 16]. Using the factors for three sigma control limits, what are x-bar chart upper and lower control limits? a. 24.65and 9.013 b. 22.43and 11.24 c. 18.9and 14.76 d. 39.83and -6.167arrow_forwardYour supervisor, Lisa Lehmann, has asked that you report on the output of a machine on the factory floor. This machine is supposed to be producing optical lenses with a meanweight of 50 grams and a range of 3.5 grams. The following table contains the data for a sample size of n = 6 taken during the past 3 hours: a) What are the :X-chart control limits when the machine is working properly?b) What are the R-charL control limits when the machine is working properly?c) What seems to be happening? (Hint: Graph the data points. Run charts may be helpful.)arrow_forwardThe overall average on a process you are attempting to monitor is 60.0 units. The process population standard deviation is 1.72. Sample size is given to be 4. Part 2 a) Determine the 3-sigma x-chart control limits. Upper Control Limit (UCLx)=enter your response here units (round your response to two decimal places). Part 3 Lower Control Limit (LCLx)=enter your response here units (round your response to two decimal places). Part 4 b) Now determine the 2-sigma x-chart control limits. Upper Control Limit (UCLx)=enter your response here units (round your response to two decimal places). Part 5 Lower Control Limit (LCLx)=enter your response here units (round your response to two decimal places). Part 6 How do the control limits change? A. The control limits are tighter for the 3-sigma x-chart than for the 2-sigma x-chart. B. The control limits for the 2-sigma x-chart and for the 3-sigma x-chart are the same. C. The control limits…arrow_forward
- Using samples of 200 credit card statements, an auditor found the following:Sample 1 2 3 4Number with errors 4 2 5 9a. Determine the fraction defective in each sample.b. If the true fraction defective for this process is unknown, what is your estimate of it?c. What is your estimate of the mean and standard deviation of the sampling distribution of fractions defective for samples of this size?d. What control limits would give an alpha risk of .03 for this process?e. What alpha risk would control limits of .047 and .003 provide?f. Using control limits of .047 and .003, is the process in control?g. Suppose that the long-term fraction defective of the process is known to be 2 percent. What arethe values of the mean and standard deviation of the sampling distribution?h. Construct a control chart for the process, assuming a fraction defective of 2 percent, using twosigma control limits. Is the process in control?arrow_forwardwhat types of error are attached in statistical process control? define and draw example. Sub: operation and supply chain managementarrow_forwardAn automatic filling machine is used to fill 1-liter bottles of cola. The machine’s output is approximately normal with a mean of 1.0 liter and standard deviation of .01 liter. Output is monitored using means of samples of 25 observations. Determine upper and lower control limits that will include roughly 97% of the sample means when the process is in control. Using Appendix B, Table A to find the value of Z corresponding to the mean control limits.arrow_forward
- What trade-offs are involved in each of these decisions?a. Deciding whether to use two-sigma or three-sigma control limits.b. Choosing between a large sample size and a smaller sample size.c. Trying to increase the capability of a process that is barely capable.arrow_forwardAt Gleditsia Triacanthos Company, a certain manufactured part is deemed acceptable if its length is between 12.45 to 12.55 inches. The process is normally distributed with an average of 12.49 inches and a standard deviation of 0.014 inches. a) is the process capable of meeting specifications? b) Does the process meet specifications?arrow_forwardUsing samples of 200 credit card statements, an auditor found the following: Sample 1 2 3 4 Number with errors 4 2 5 9 a. Determine the fraction defective in each sample. b. If the true fraction defective for this process is unknown, what is your estimate of it? c. What is your estimate of the mean and standard deviation of the sampling distribution of fractions defective for samples of this size? d. What control limits would give an alpha risk of .03 for this process? Page 457 e. What alpha risk would control limits of .047 and .003 provide? f. Using control limits of .047 and .003, is the process in control? g. Suppose that the long-term fraction defective of the process is known to be 2 percent. What are the values of the mean and standard deviation of the sampling distribution? h. Construct a control chart for the process, assuming a fraction defective of 2 percent, using two-sigma control limits. Is the process in control? Can you show me the steps and formulas using excelarrow_forward
- Rosters Chicken advertises " lite" chicken with 30% fewer calories than standard chicken. When the process for "lite" chicken breast production is in control, the average chicken breast contains 420 calories, and the standard deviation in caloric content of the chicken breast population is 25 calories. Rosters wants to design an x-chart to monitor the caloric content of chicken breasts, where 25 chicken breasts would be chosen at random to form each sample.a) What are the lower and upper control limits for th.is chart if these limits are chosen to be four standard deviations from the target?b) What a re the limits with three standard deviations from the target?arrow_forwardA process generating attribute data has an estimated sigma capability = 3.3. Assuming the process mean is shifted +/- 1.5 sigma from the target value, what is the estimated dpmo? Estimated dpmo = ____.arrow_forwardAt Webster Chemical Company, lumps in the caulking compound could cause difficulties in dispensing a smooth bead from the tube. Even when the process is in control, an average of four lumps per tube of caulk will remain. Testing for the presence of lumps destroys the product, so an analyst takes random samples. The following results are obtained: Tube No. Lumps Tube No. Lumps Tube No. Lumps 1 6 5 6 9 5 2 5 6 4 10 0 3 0 7 1 11 9 4 4 8 6 12 2 Determine the c-chart two-sigma upper and lower control limits for this process. Is the process in statistical control?arrow_forward
 Practical Management ScienceOperations ManagementISBN:9781337406659Author:WINSTON, Wayne L.Publisher:Cengage,
 Operations ManagementOperations ManagementISBN:9781259667473Author:William J StevensonPublisher:McGraw-Hill Education
 Operations and Supply Chain Management (Mcgraw-hi...Operations ManagementISBN:9781259666100Author:F. Robert Jacobs, Richard B ChasePublisher:McGraw-Hill Education
 Purchasing and Supply Chain ManagementOperations ManagementISBN:9781285869681Author:Robert M. Monczka, Robert B. Handfield, Larry C. Giunipero, James L. PattersonPublisher:Cengage Learning
 Production and Operations Analysis, Seventh Editi...Operations ManagementISBN:9781478623069Author:Steven Nahmias, Tava Lennon OlsenPublisher:Waveland Press, Inc.