
Concept explainers
a)
To determine: The fraction defective in each sample.
Introduction: Quality is a measure of excellence or a state of being free from deficiencies, defects and important variations. It is obtained by consistent and strict commitment to certain standards to attain uniformity of a product to satisfy consumers’ requirement.
a)
Answer to Problem 5P
Explanation of Solution
Given information:
| Sample | 1 | 2 | 3 | 4 |
| Number with errors | 4 | 2 | 5 | 9 |
Calculation of fraction defective in each sample:
| n | 200 | |||
| Sample | 1 | 2 | 3 | 4 |
| Number with errors | 4 | 2 | 5 | 9 |
| Prop defective | 0.02 | 0.01 | 0.025 | 0.045 |
Excel Worksheet:
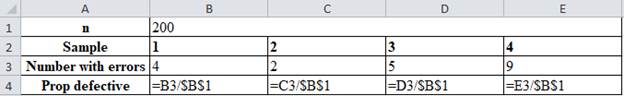
The proportion defective is calculated by dividing the number of errors with the number of samples. For sample 1, the number of errors 4 is divided by 200 which give 0.02 as prop defective.
Hence, the fraction defective is shown in Table 1.
b)
To determine: The estimation for fraction defective when true fraction defective for the process is unknown.
Introduction: Quality is a measure of excellence or a state of being free from deficiencies, defects and important variations. It is obtained by consistent and strict commitment to certain standards to attain uniformity of a product to satisfy consumers’ requirement.
b)
Answer to Problem 5P
Explanation of Solution
Given information:
| Sample | 1 | 2 | 3 | 4 |
| Number with errors | 4 | 2 | 5 | 9 |
Calculation of fraction defective:
The fraction defective is calculated when true fraction defective is unknown.
Total number of defective is calculated by adding the number of errors, (4+2+5+9) which accounts to 20
The fraction defective is calculated by dividing total number of defective with total number of observation which is 20 is divided with the product of 4 and 200 which is 0.025.
Hence, the fraction defective is 0.025.
c)
To determine: The estimate of mean and standard deviation of the sampling distribution of fraction defective for samples for the size.
Introduction:
Control chart:
It is a graph used to analyze the process change over a time period. A control chart has a upper control limit, and lower control which are used plot the time order.
c)
Answer to Problem 5P
Explanation of Solution
Given information:
| Sample | 1 | 2 | 3 | 4 |
| Number with errors | 4 | 2 | 5 | 9 |
Estimate of mean and standard deviation of the sampling distribution:
Mean = 0.025 (from equation (1))
The estimate for mean is shown in equation (1) and standard deviation is calculated by substituting the value which yields 0.011.
Hence, estimate of mean and standard deviation of the sampling distribution is 0.025 and 0.011.
d)
To determine: The control limits that would give an alpha risk of 0.03 for the process.
Introduction:
Control chart:
It is a graph used to analyze the process change over a time period. A control chart has a upper control limit, and lower control which are used plot the time order.
d)
Answer to Problem 5P
Explanation of Solution
Given information:
| Sample | 1 | 2 | 3 | 4 |
| Number with errors | 4 | 2 | 5 | 9 |
Control limits that would give an alpha risk of 0.03 for the process:
0.015 is in each tail and using z-factor table, value that corresponds to 0.5000 – 0.0150 is 0.4850 which is z = 2.17.
The UCL is calculated by adding 0.025 with the product of 2.17 and 0.011 which gives 0.0489 and LCL is calculated by subtracting 0.025 with the product of 2.17 and 0.011 which yields 0.0011.
Hence, the control limits that would give an alpha risk of 0.03 for the process are 0.0489 and 0.0011.
e)
To determine: The alpha risks that control limits 0.47 and 0.003 will provide.
Introduction:
Control chart:
It is a graph used to analyze the process change over a time period. A control chart has a upper control limit, and lower control which are used plot the time order.
e)
Answer to Problem 5P
Explanation of Solution
Given information:
| Sample | 1 | 2 | 3 | 4 |
| Number with errors | 4 | 2 | 5 | 9 |
Alpha risks that control limits 0.47 and 0.003 will provide:
The following equation z value can be calculated,
From z factor table, the probability value which corresponds to z = 2.00 is 0.4772, on each tail,
0.0228 is observed on each tail and doubling the value gives 0.0456 which is the alpha risk.
Hence, alpha risks that control limits 0.47 and 0.003 will provide is 0.0456
f)
To determine: Whether the process is in control when using 0.047 and 0.003.
Introduction:
Control chart:
It is a graph used to analyze the process change over a time period. A control chart has an upper control limit, and lower control which are used plot the time order.
f)
Answer to Problem 5P
Explanation of Solution
Given information:
| Sample | 1 | 2 | 3 | 4 |
| Number with errors | 4 | 2 | 5 | 9 |
Calculation of fraction defective in each sample:
| n | 200 | |||
| Sample | 1 | 2 | 3 | 4 |
| Number with errors | 4 | 2 | 5 | 9 |
| Prop defective | 0.02 | 0.01 | 0.025 | 0.045 |
UCL = 0.047 & LCL = 0.003
Graph:
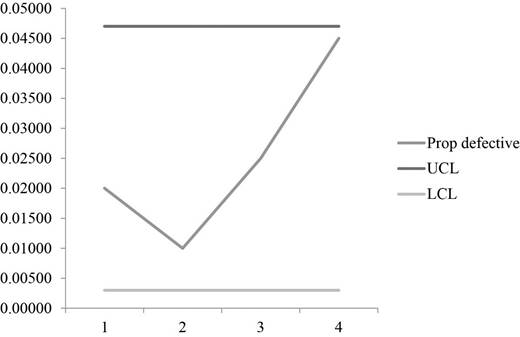
A graph is plotted using UCL, LCL and prop defective values which show that all the sample points are well within the control limits which makes the process to be in control.
Hence, the process is within control for the limits 0.047 & 0.003.
g)
To determine: The mean and standard deviation of the sampling distribution.
Introduction:
Control chart:
It is a graph used to analyze the process change over a time period. A control chart has a upper control limit, and lower control which are used plot the time order.
g)
Answer to Problem 5P
Explanation of Solution
Given information:
| Sample | 1 | 2 | 3 | 4 |
| Number with errors | 4 | 2 | 5 | 9 |
Long run fraction defective of the process is 0.02
Calculation of mean and standard deviation of the sampling distribution:
Fraction defective in each sample:
| n | 200 | |||
| Sample | 1 | 2 | 3 | 4 |
| Number with errors | 4 | 2 | 5 | 9 |
| Prop defective | 0.02 | 0.01 | 0.025 | 0.045 |
The mean is calculated by taking average for the proportion defective,
The values of the proportion defective are added and divided by 4 which give 0.02.
The standard deviation is calculated using the formula,
The standard deviation is calculated by substituting the values in the above formula and taking square root for the resultant value which yields 0.099.
Hence, mean and standard deviation of the sampling distribution is 0.02&0.0099.
h)
To construct: A control chart using two sigma control limits and check whether the process is in control.
Introduction:
Control chart:
It is a graph used to analyze the process change over a time period. A control chart has a upper control limit, and lower control which are used plot the time order.
h)
Answer to Problem 5P
Explanation of Solution
Given information:
| Sample | 1 | 2 | 3 | 4 |
| Number with errors | 4 | 2 | 5 | 9 |
Fraction defective in each sample:
| n | 200 | |||
| Sample | 1 | 2 | 3 | 4 |
| Number with errors | 4 | 2 | 5 | 9 |
| Prop defective | 0.02 | 0.01 | 0.025 | 0.045 |
Calculation of control limits:
The control limits are calculated using the above formula and substituting the values and taking square root gives the control limits of the UCL and LCL which are 0.0398 and 0.0002 respectively.
Graph:
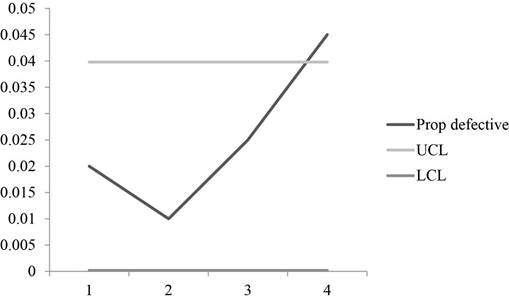
A graph is plotted using the fraction defective, UCL and LCL values which shows that one sample points is beyond the control region which makes the process to be out of control.
Hence, control chart is constructed using two-sigma control limits and the chart shows that the process is not in control.
Want to see more full solutions like this?
Chapter 10 Solutions
Operations Management (McGraw-Hill Series in Operations and Decision Sciences)


- Using samples of 197 credit card statements, an auditor found the following: Sample 1 3 errors Sample 2 3 errors Sample 3 5 errors Sample 4 9 errors 1. what alpha risk would control limits of .0470 and .0038 provide? 2. Using control limits of .0470 and .0038, is the process in control? 3. Construct a control chart for the process, assuming a fraction defective of 2 percent, using two-sigma control limits. Is the process in control?arrow_forwardRepresentatives of the Patriot Insurance Company take medical information over the telephone from prospective policy applicants prior to a visit to the applicant’s place of residence by a registered nurse who takes vital sign measurements. When the telephone interview has incorrect or incomplete information, the entire process of approving the application is unnecessarily delayed and has the potential of causing loss of business. The following data were collected to see how many applications contain errors. Each sample has 200 randomlyselected applications. Sample Defects Sample Defects 1 2 3 4 5 6 7 8 9 10 11 12 13 14 15 20 18 29 12 14 11 30 25 27 16 25 18 25 16 20 16 17 18 19 20 21 22 23 24 25 26 27 28 29 30 15 40 35 21 24 9 20 17 28 10 17 22 14 19 20 a. What are the upper and lower control limits of a p-chart for the number of defective applications? Use z = 3.b. Is the process in statistical control?arrow_forwardSuppose that a quality characteristic is normally distributed with specifications at 100 ± 20. The process standard deviation is 6.(a) Suppose that the process mean is 100. What are the natural tolerance limits? Calculate Cp and Cpk and interpret these ratios. What fraction of parts do you expect to be defective?(b) Suppose that the process mean is 106. What are the natural tolerance limits? What is thefraction defective? Calculate Cp and Cpk and interpret these ratios.arrow_forward
- C-Spec, Inc., is attempting to determine whether an existing machine is capable of milling an engine part that has a key specification of 4 ± .003 inches. After a trial run on this machine, C-Spec has determined that the machine has a sample mean of 4.001 inches witha standard deviation of .002 inch. (Answer in Appendix D)a. Calculate the Cpk for this machine.b. Should C-Spec use this machine to produce this part? Why?arrow_forwardBlueMoon Bottlers has a bottle-filling process with a mean value of 64 ounces and a standard deviation of 8 ounces. Suppose the upper and lower specification limits are 71 and 57 ounces, respectively. What is the process capability index of this process? (Note: You MUST show every single step and detailed derivation for full credit)arrow_forwardAt Gleditsia Triacanthos Company, a certain manufactured part is deemed acceptable if its lengthis between 12.45 to 12.55 inches. The process is normally distributed with an average of 12.49inches and a standard deviation of 0.014 inches. A) Is the process capable of meeting specifications? B) Does the process meet specifications?arrow_forward
- At Gleditsia Triacanthos Company, a certain manufactured part is deemed acceptable if its length is between 12.45 to 12.55 inches. The process is normally distributed with an average of 12.49 inches and a standard deviation of 0.014 inches. a) is the process capable of meeting specifications? b) Does the process meet specifications?arrow_forwardAt Webster Chemical Company, lumps in the caulking compound could cause difficulties in dispensing a smooth bead from the tube. Even when the process is in control, an average of four lumps per tube of caulk will remain. Testing for the presence of lumps destroys the product, so an analyst takes random samples. The following results are obtained: Tube No. Lumps Tube No. Lumps Tube No. Lumps 1 6 5 6 9 5 2 5 6 4 10 0 3 0 7 1 11 9 4 4 8 6 12 2 Determine the c-chart two-sigma upper and lower control limits for this process. Is the process in statistical control?arrow_forwardJim’s Outfitters, Inc., makes custom fancy shirts for cowboys. The shirts could be flawed in various ways, including flaws in the weave or color of the fabric, loose buttons or decorations, wrong dimensions, and uneven stitches. Jim randomly examined 10 shirts, with the following results:Shirt Defects1 82 03 74 125 56 107 28 49 610 6a. Assuming that 10 observations are adequate for these purposes, determine the three-sigma control limits for defects per shirt.b. Suppose that the next shirt has 13 flaws. What can you say about the process now?arrow_forward
- 3.1.The Great North Woods Clothing Company sells specialty outdoor clothing through its catalog. A quality problem that generates customer complaints occurs when a warehouse employee fills an order with the wrong items. The company has decided to implement a process control plan by inspecting the ordered items after they have been obtained from the warehouse and before they have been packaged. The company has taken 30 samples (during a 30-day period), each for 100 orders, and recorded the number of defective orders in each sample, as follows Sample Number of Defectives Sample Number of Defectives 1 12 16 6 2 14 17 3 3 10 18 7 4…arrow_forwardAn operator wants to determine the standard deviation for a machine she operates. To do this, she wants to create a p-chart. Over a month's time, she collects 30 samples of 75 observations each and records the number of errors. The average proportion defective is found to be 0.024. Which of the following is the standard deviation () of the machine? a. More than 0.5 but less than or equal to 1.0 b. More than 1.0 c. Less than or equal to 0.1 d. More than 0.1 but less than or equal to 0.5arrow_forwardRosters Chicken advertises " lite" chicken with 30% fewer calories than standard chicken. When the process for "lite" chicken breast production is in control, the average chicken breast contains 420 calories, and the standard deviation in caloric content of the chicken breast population is 25 calories. Rosters wants to design an x-chart to monitor the caloric content of chicken breasts, where 25 chicken breasts would be chosen at random to form each sample.a) What are the lower and upper control limits for th.is chart if these limits are chosen to be four standard deviations from the target?b) What a re the limits with three standard deviations from the target?arrow_forward
 Practical Management ScienceOperations ManagementISBN:9781337406659Author:WINSTON, Wayne L.Publisher:Cengage,
 Operations ManagementOperations ManagementISBN:9781259667473Author:William J StevensonPublisher:McGraw-Hill Education
 Operations and Supply Chain Management (Mcgraw-hi...Operations ManagementISBN:9781259666100Author:F. Robert Jacobs, Richard B ChasePublisher:McGraw-Hill Education
 Purchasing and Supply Chain ManagementOperations ManagementISBN:9781285869681Author:Robert M. Monczka, Robert B. Handfield, Larry C. Giunipero, James L. PattersonPublisher:Cengage Learning
 Production and Operations Analysis, Seventh Editi...Operations ManagementISBN:9781478623069Author:Steven Nahmias, Tava Lennon OlsenPublisher:Waveland Press, Inc.