
Statistical Reasoning for Everyday Life, Books a la Carte Edition, Plus NEW MyLab Statistics with Pearson eText -- Access Card Package (5th Edition)
5th Edition
ISBN: 9780134668390
Author: Jeffrey O. Bennett, William L. Briggs, Mario F. Triola
Publisher: PEARSON
expand_more
expand_more
format_list_bulleted
Videos
Textbook Question
Chapter 10, Problem 2CQ
As part of the results from the test described in Exercise 1, the P-value of 0.001 is obtained. What do you conclude?
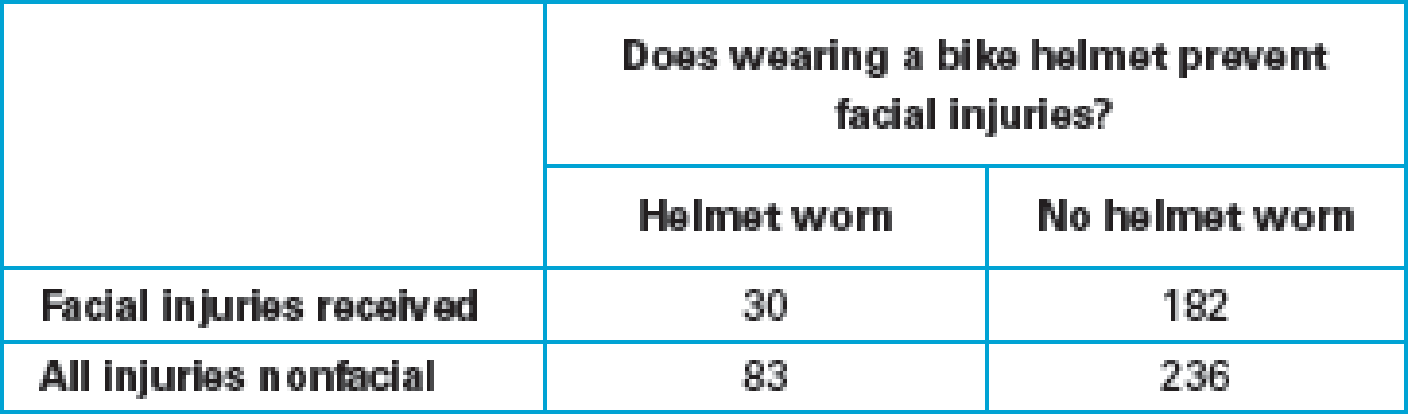
- 1. Assuming that we want to use the data in the table below to test for independence between wearing a helmet and receiving facial injuries in a bicycle accident, find the expected frequency for the cell with an observed frequency of 83.
Expert Solution & Answer
Want to see the full answer?
Check out a sample textbook solution
Students have asked these similar questions
The Office of the university registrar would like to know if such degree programs are related to the gender of the students. The test claim that the proportions of the students enrolled are equal in each degree program at alpha=0.10
Using the data on the number of currently enrolled students in each gender (M of F) in each of the four degree programs, find the:
a. Table showing the observed and expected values
b. Chi-square critical Value
c. Chi-square test statistic
d. Accept or Reject the null hypothesis?
A researcher conducts ANOVA and calculates a test statistic of F=5.73. If dftotal = 14, dfwithin = 12, and dfbetween = 2, which of the following will the researcher conclude, using alpha = .01?
a. Reject Ho
b. Fail to reject Ho
c. Cannot be determined
A sample of 100 randomly selected children under the age of 12 showed that the average amount of time a child spends watching TV every day is 2.7 hours. The value of test statistic ( along with decision) to test the claim that the average time a child spends watching is greater than 2.6 hours ( assume alpha = 0.6 and alpha 0.01), is:
Chapter 10 Solutions
Statistical Reasoning for Everyday Life, Books a la Carte Edition, Plus NEW MyLab Statistics with Pearson eText -- Access Card Package (5th Edition)
Ch. 10.1 - t Distribution. What is the t distribution? What...Ch. 10.1 - Degrees of Freedom. How do you determine the...Ch. 10.1 - Prob. 3ECh. 10.1 - Hypothesis Test. Briefly summarize the procedure...Ch. 10.1 - Does It Make Sense? For Exercises 58, determine...Ch. 10.1 - Prob. 6ECh. 10.1 - Prob. 7ECh. 10.1 - Prob. 8ECh. 10.1 - Confidence Intervals. In Exercises 918, use the t...Ch. 10.1 - Confidence Intervals. In Exercises 918, use the t...
Ch. 10.1 - Elbow-to-Fingertip Length of Men. A simple random...Ch. 10.1 - Earthquake Epicenter Depths. A simple random...Ch. 10.1 - Hospital Costs with Seat Belts. A study was...Ch. 10.1 - Prob. 14ECh. 10.1 - Estimating Car Pollution. Each car in a sample of...Ch. 10.1 - Movie Lengths. Listed below are lengths (in...Ch. 10.1 - Prob. 17ECh. 10.1 - Prob. 18ECh. 10.1 - Hypothesis Tests. In Exercises 1928, test the...Ch. 10.1 - Prob. 20ECh. 10.1 - Hypothesis Tests. In Exercises 1928, test the...Ch. 10.1 - Prob. 22ECh. 10.1 - Hypothesis Tests. In Exercises 1928, test the...Ch. 10.1 - Hypothesis Tests. In Exercises 1928, test the...Ch. 10.1 - Prob. 25ECh. 10.1 - Prob. 26ECh. 10.1 - Prob. 27ECh. 10.1 - Prob. 28ECh. 10.2 - Two-Way Tables. What is a two-way table? What are...Ch. 10.2 - Hypotheses. When working with two variables in a...Ch. 10.2 - Prob. 3ECh. 10.2 - Prob. 4ECh. 10.2 - Does It Make Sense? For Exercises 58, determine...Ch. 10.2 - Does It Make Sense? For Exercises 58, determine...Ch. 10.2 - Does It Make Sense? For Exercises 58, determine...Ch. 10.2 - Does It Make Sense? For Exercises 58, determine...Ch. 10.2 - Prob. 9ECh. 10.2 - Understanding a Two-Way Table Hypothesis Test....Ch. 10.2 - Survey Results. In Exercises 1114, assume that a...Ch. 10.2 - Survey Results. In Exercises 1114, assume that a...Ch. 10.2 - Survey Results. In Exercises 1114, assume that a...Ch. 10.2 - Survey Results. In Exercises 1114, assume that a...Ch. 10.2 - Prob. 15ECh. 10.2 - Complete Hypothesis Test. In Exercises 1522, carry...Ch. 10.2 - Complete Hypothesis Test. In Exercises 1522, carry...Ch. 10.2 - Complete Hypothesis Test. In Exercises 1522, carry...Ch. 10.2 - Complete Hypothesis Test. In Exercises 1522, carry...Ch. 10.2 - Prob. 20ECh. 10.2 - Prob. 21ECh. 10.2 - Prob. 22ECh. 10.3 - ANOVA. What does ANOVA stand for? What is the...Ch. 10.3 - Prob. 2ECh. 10.3 - Variance in ANOVA. Describe and distinguish...Ch. 10.3 - Test Statistic F. What is the meaning of small and...Ch. 10.3 - Prob. 5ECh. 10.3 - Prob. 6ECh. 10.3 - Does It Make Sense? For Exercises 58, determine...Ch. 10.3 - Does It Make Sense? For Exercises 58, determine...Ch. 10.3 - Prob. 9ECh. 10.3 - Comparing Colleges. A researcher obtains random...Ch. 10.3 - Readability of Authors. Samples of Flesch-Kincaid...Ch. 10.3 - Fabric Flammability Tests in Different...Ch. 10.3 - Prob. 13ECh. 10.3 - Pulse Rates. A random sample of adult females is...Ch. 10.3 - Using Technology. In Exercises 1518, use software...Ch. 10.3 - Using Technology. In Exercises 1518, use software...Ch. 10.3 - Prob. 17ECh. 10.3 - Using Technology. In Exercises 1518, use software...Ch. 10 - In Exercises 13, use the following service times...Ch. 10 - In Exercises 13, use the following service times...Ch. 10 - In Exercises 13, use the following service times...Ch. 10 - Prob. 4CRECh. 10 - Prob. 1CQCh. 10 - As part of the results from the test described in...Ch. 10 - For the hypothesis test described in Exercise 1,...Ch. 10 - A simple random sample of 25 blood platelet counts...Ch. 10 - Prob. 5CQCh. 10 - Prob. 6CQCh. 10 - Prob. 7CQCh. 10 - If the hypothesis test of the claim described in...Ch. 10 - A two-way table, constructed from survey results,...Ch. 10 - Prob. 10CQ
Knowledge Booster


Learn more about
Need a deep-dive on the concept behind this application? Look no further. Learn more about this topic, statistics and related others by exploring similar questions and additional content below.Similar questions
- A sample of 8 people participated in a low calorie weight loss program for 16 weeks. Each of the participants had their weight (in pounds) recorded before they started the program and after they finished the program. The following results were obtained. At the 0.05 level of significance, test the claim that, on average, this 16 week low calorie weight loss program is effective? Assume that the amount of weight people lose after 16 weeks participating in this low calorie weight loss program reasonably follows a normal distribution.arrow_forwardA nationwide study of undergraduate students reported that the mean number of drinks consumed per week during the spring semester is 7.96. The mean number of drinks consumed per week at USC is 7.64 (s.d.=2.55, N=412 Health services is concerned that USC students are consuming significantly more alcohol per week than the national average. Using an alpha level of .05, Is there sufficient evidence to be concerned? Be sure to select the correct critical value for the alternative hypothesis, and then use this evidence to make your conclusionarrow_forwardSuppose that a group of researchers is planning to test a new weight loss supplement. They have selected a random sample of 45 people who are trying to lose weight and plan to measure the amount of weight lost after one month of using the supplement. Assume that the researchers know from prior experiments that the standard deviation of weight lost in one month, , is 1.7 lb. To show that the supplement is effective, they plan to use a one-sample z‑test of Ho : u= 0lb against H1 : u > 0lb , where is the mean amount of weight lost in one month. They have also determined that, for a test with a significance level of 0.05, the power of the test is 0.9347 if the mean amount of weight lost is actually 0.8 lb. What is the probability that the researchers will reject their null hypothesis if the mean amount of weight lost is 0.8 lb or more? Give your answer as a percentage, precise to two decimal places.arrow_forward
- Consider a random sample X1,...,Xn,... ∼ iid Beta(θ,1) for n > 2. Prove that the MLE and UMVUE are both consistent estimators for θarrow_forwardSuppose researchers draw a sample of 300 breakfast sandwiches from a certain fast-food restaurant, and carry out a t test of the null hypothesis that the true mean sodium content is 1000, against the alternative hypothesis that it is greater than 1000. They find a negative value of the test statistic, and a p-value of 0.85. What would the p-value have been had they used a two-sided alternative hypothesis? (Give your response to at least 3 decimal places. Give only your numeric response, and not any extra characters or symbols.)arrow_forwardBased on these data, can the consumer group conclude, at the 0.05 level of significance, that the mean tread wear of Brand 2 exceeds that of Brand 1? Answer this question by performing a hypothesis test regarding μd (which is μ with a letter "d" subscript), the population mean difference in tread wear for the two brands of tires. Assume that this population of differences (Brand 1 minus Brand 2) is normally distributed.Perform a one-tailed test. Then complete the parts below. Carry your intermediate computations to three or more decimal places and round your answers as specified. (If necessary, consult a list of formulas.) A. Find the value of the test statistic. (Round to three or more decimal places.) B. Find the critical value at the 0.05 level of significance. (Round to three or more decimal places.) C. At the 0.05 level, can the consumer group conclude that mean tread wear of Brand 2 exceeds that of Brand 1?arrow_forward
- Based on these data, can the consumer group conclude, at the 0.05 level of significance, that the mean tread wear of Brand 2 exceeds that of Brand 1? Answer this question by performing a hypothesis test regarding μd (which is μ with a letter "d" subscript), the population mean difference in tread wear for the two brands of tires. Assume that this population of differences (Brand 1 minus Brand 2) is normally distributed.Perform a one-tailed test. Then complete the parts below. Carry your intermediate computations to three or more decimal places and round your answers as specified. (If necessary, consult a list of formulas.) A. Find the critical value at the 0.05 level of significance. (Round to three or more decimal places.)arrow_forwardEvans conducted a study to determine if the frequency and characteristics of pediatric problems in elderly patients with diabetes present differences with respect to patients of the same age, but without diabetes. The individuals studied, interned in a clinic, were between 70 and 90 years old. Among the researchers' findings are the following statistics. with respect to the scores on the deep tendon reflexes meters:Sample without Diabetes: 79 / 2.1 / 1.1With Diabetes: 74 / 1.6 / 1.2Is it possible to conclude, based on the data, that, on average, diabetic patients they have reduced deep tendon reflexes in comparison with patients without diabetes of the same age?arrow_forward
arrow_back_ios
arrow_forward_ios
Recommended textbooks for you
 Holt Mcdougal Larson Pre-algebra: Student Edition...AlgebraISBN:9780547587776Author:HOLT MCDOUGALPublisher:HOLT MCDOUGAL
Holt Mcdougal Larson Pre-algebra: Student Edition...
Algebra
ISBN:9780547587776
Author:HOLT MCDOUGAL
Publisher:HOLT MCDOUGAL
Hypothesis Testing using Confidence Interval Approach; Author: BUM2413 Applied Statistics UMP;https://www.youtube.com/watch?v=Hq1l3e9pLyY;License: Standard YouTube License, CC-BY
Hypothesis Testing - Difference of Two Means - Student's -Distribution & Normal Distribution; Author: The Organic Chemistry Tutor;https://www.youtube.com/watch?v=UcZwyzwWU7o;License: Standard Youtube License