
Concept explainers
Videos
Complete Hypothesis Test. In Exercises 15–22, carry out the following steps.
- a. State the null and alternative hypotheses.
- b. Assuming independence between the two variables, find the expected frequency for each cell of the table.
- c. Find the value of the χ2 statistic.
- d. Use the given significance level to find the χ2 critical value.
- e. Using the given significance level, complete the test of the claim that the two variables are independent. State the conclusion that addresses the original claim.
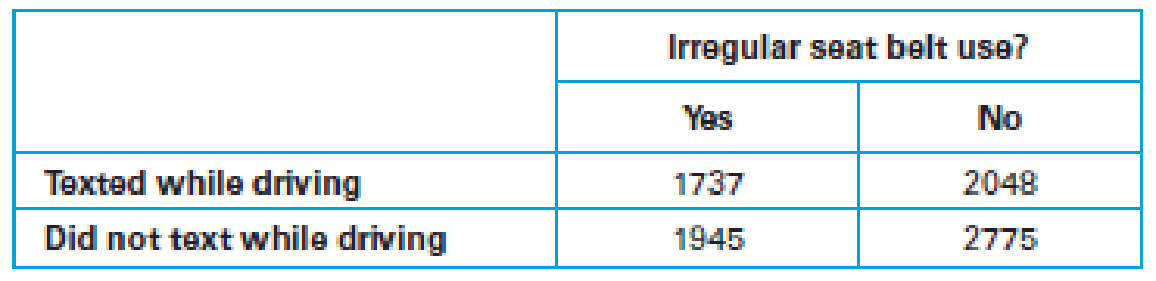
16. Texting and Seat Belt Use. In a study of high school students at least 16 years of age, researchers obtained the survey results summarized in the accompanying table (based on data from “Texting While Driving and Other Risky Motor Vehicle Behaviors Among U.S. High School Students” by O’Malley, Shults, and Eaton, Pediatrics, Vol. 131, No. 6). Use a 0.05 significance level to test the claim of independence between texting while driving and irregular seat belt use. Are those two risky behaviors independent of each other?
Want to see the full answer?
Check out a sample textbook solution
Chapter 10 Solutions
Statistical Reasoning for Everyday Life, Books a la Carte Edition, Plus NEW MyLab Statistics with Pearson eText -- Access Card Package (5th Edition)


- In Exercises, the null hypothesis is H0:µ1 = µ2 and the alternative hypothesis is as specified. We have provided data from a simple random paired sample from the two populations under consideration. In each case, use the paired t-test to perform the required hypothesis test at the 10% significance level. Ha: µ1 >µ2 Observation from Pair Population 1 Population 2 1 7 3 2 4 5 3 9 8 4 7 2 5 19 16 6 12 12 7 13 18 8 5 11arrow_forwardTest the claim that the proportion of people who own cats is smaller than 20% at the 0.005 significance level.The null and alternative hypothesis would be: Select One ______ H0:p≤0.2H0:p≤0.2Ha:p>0.2Ha:p>0.2 _______H0:μ≥0.2H0:μ≥0.2Ha:μ<0.2Ha:μ<0.2 _____H0:μ=0.2H0:μ=0.2Ha:μ≠0.2Ha:μ≠0.2 ______H0:p=0.2H0:p=0.2Ha:p≠0.2Ha:p≠0.2 _______H0:p≥0.2H0:p≥0.2Ha:p<0.2Ha:p<0.2 ______H0:μ≤0.2H0:μ≤0.2Ha:μ>0.2Ha:μ>0.2 The test is: Select One ___two-tailed ___left-tailed ___right-tailed Based on a sample of 600 people, 19% owned catsThe test statistic is: __?__ (Round to 2 decimals)The p-value is: __?__ (Round to 2 decimals)arrow_forwardTest the claim that the proportion of people who own cats is smaller than 50% at the 0.025 significance level.The null and alternative hypothesis would be: H0:p≤0.5H0:p≤0.5Ha:p>0.5Ha:p>0.5 H0:μ≥0.5H0:μ≥0.5Ha:μ<0.5Ha:μ<0.5 H0:p=0.5H0:p=0.5Ha:p≠0.5Ha:p≠0.5 H0:p≥0.5H0:p≥0.5Ha:p<0.5Ha:p<0.5 H0:μ=0.5H0:μ=0.5Ha:μ≠0.5Ha:μ≠0.5 H0:μ≤0.5H0:μ≤0.5Ha:μ>0.5Ha:μ>0.5 The test is: right-tailed two-tailed left-tailed Based on a sample of 700 people, 43% owned catsThe test statistic is: (Round to 2 decimals)The p-value is: (Round to 2 decimals)Based on this we: Reject the null hypothesis Do not reject the null hypothesisarrow_forward
- Test the null hypothesis H0 : β1 = β2 against the alternative H1 : β1 < β2 at 1% significance level.arrow_forwardIn each of Exercises, we have given the P-value for a hypothesis test. For each exercise, refer to Table to determine the strength of the evidence against the null hypothesis. P-value Evidence against H0 P > 0.10 Weak or none 0.05 < P ≤ 0.10 Moderate 0.01 < P ≤ 0.05 Strong P ≤ 0.01 Very strong P = 0.086arrow_forwardConsider the following statements: I. As far as the probability of a Type I error is concerned, a two-tailed hypothesis test is more accurate than a one-tailed hypothesis test. II. A point estimation procedure in a one sample scenario utilizes information in a sample to arrive at two points, one positive and one negative in order to estimate the population parameter of interest. a. I and II are both true. b. I and II are both false. c. I is true and II is false. d. I is false and II is true. e. I is false and II is sometimes true.arrow_forward
- In each of Exercises, we have provided a null hypothesis and alternative hypothesis and a sample from the population under consideration. In each case, use theWilcoxon signed-rank test to perform the required hypothesis test at the 10% significance level. H0: µ = 10, Ha: µ<10 7 6 5 12 15 14 13 4arrow_forwardIn each of Exercises, we have provided a null hypothesis and alternative hypothesis and a sample from the population under consideration. In each case, use theWilcoxon signed-rank test to perform the required hypothesis test at the 10% significance level. H0: µ = 5, Ha: µ > 5 12 7 11 9 3 2 8 6arrow_forwardTest the claim that the mean GPA of night students is larger than 2.2 at the 0.10 significance level.The null and alternative hypothesis would be: H0:p≤0.55H0:p≤0.55HA:p>0.55HA:p>0.55 H0:μ=2.2H0:μ=2.2HA:μ≠2.2HA:μ≠2.2 H0:μ≥2.2H0:μ≥2.2HA:μ<2.2HA:μ<2.2 H0:p=0.55H0:p=0.55HA:p≠0.55HA:p≠0.55 H0:p≥0.55H0:p≥0.55HA:p<0.55HA:p<0.55 H0:μ≤2.2H0:μ≤2.2HA:μ>2.2HA:μ>2.2 The test is: left-tailed two-tailed right-tailed Based on a sample of 35 people, the sample mean GPA was 2.25 with a standard deviation of 0.03The p-value is: (to 2 decimals)Based on this we: Reject the null hypothesis Fail to reject the null hypothesisarrow_forward
 MATLAB: An Introduction with ApplicationsStatisticsISBN:9781119256830Author:Amos GilatPublisher:John Wiley & Sons Inc
 Probability and Statistics for Engineering and th...StatisticsISBN:9781305251809Author:Jay L. DevorePublisher:Cengage Learning
 Statistics for The Behavioral Sciences (MindTap C...StatisticsISBN:9781305504912Author:Frederick J Gravetter, Larry B. WallnauPublisher:Cengage Learning
 Elementary Statistics: Picturing the World (7th E...StatisticsISBN:9780134683416Author:Ron Larson, Betsy FarberPublisher:PEARSON
 The Basic Practice of StatisticsStatisticsISBN:9781319042578Author:David S. Moore, William I. Notz, Michael A. FlignerPublisher:W. H. Freeman
 Introduction to the Practice of StatisticsStatisticsISBN:9781319013387Author:David S. Moore, George P. McCabe, Bruce A. CraigPublisher:W. H. Freeman