
Concept explainers
Videos
a.
State the hypotheses.
Find the test statistic and p-value.
Interpret the results.
a.
Answer to Problem 46CE
Hypotheses:
The test statistic is 0.484.
The p-value is 0.3142.
There is no evidence to infer that the first group is better than the second group.
Explanation of Solution
Calculation:
In a sample of first 25 papers, 10 received a B or better and in a sample of last 24 papers, 8 received a B or better.
Here, the claim is that first group is better than second group.
Here, the direction of the test is right-tailed.
Assume
State the hypotheses:
Null hypothesis:
That is,the population proportion of first group is not greater than the population proportion of second group.
Alternative hypothesis:
That is, the population proportion of first group is greater than the population proportion of second group.
Sketch the decision rule:
Software procedure:
Step-by-step software procedure to obtain critical value using Megastat is as follows:
- • In EXCEL, Select Add-Ins>MegaStat>Probability.
- • Choose Continuous probability distributions.
- • Select
Normal distribution and select calculate z given P and enter P as 0.10. - • Enter mean as 0 and standard deviation as 1.
- • In shading, selectUpper-tail.
- • Click Ok.
- Output using Megastat software is given below:
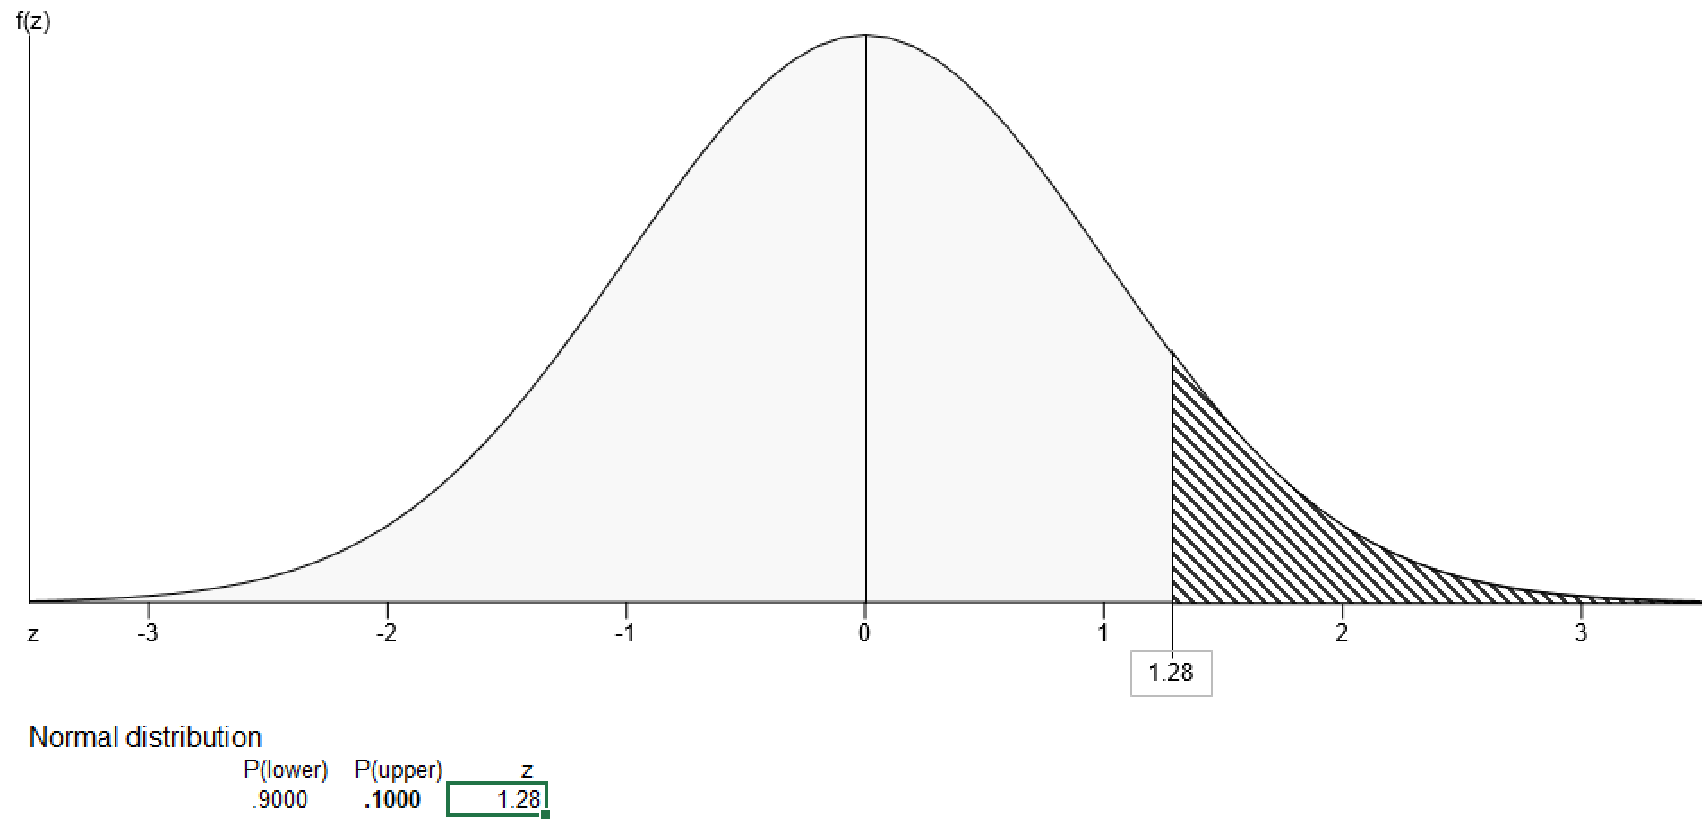
From the output, the critical value is +1.28.
Decision rule:
If
Sample proportion for first group:
Thus, the sample proportion for first group is 0.4.
Sample proportion for second group:
Thus, the sample proportion for second group is 0.3333.
Pooled proportion:
Thus, the pooled proportion is 0.3673.
Test statistic:
Thus, the test statistic is 0.484.
p-value:
Software procedure:
Step-by-step software procedure to obtain p-value using EXCEL is as follows:
- • Open an EXCEL file.
- • In cell A1, enter the formula “=NORM.S.DIST(0.484,1)”
- Output using Excel software is given below:
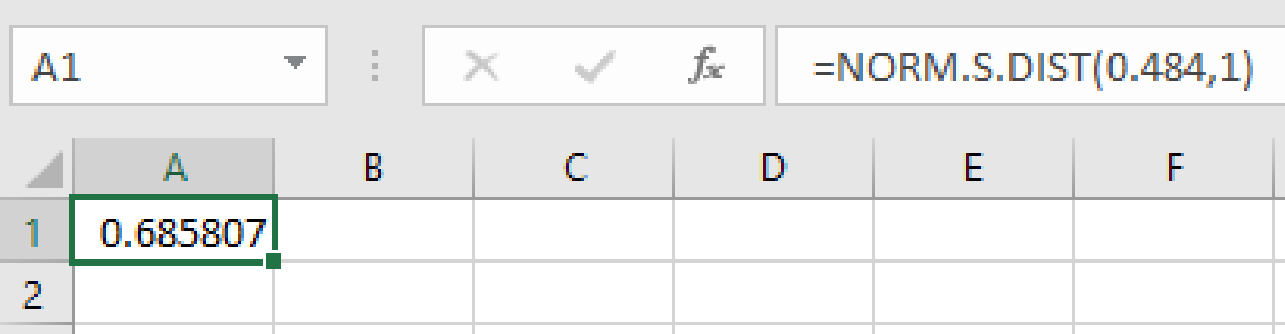
From the output, the p-value for right tailed test is,
Thus, the p-value is 0.3142.
Decision rule:
If
Conclusion for p-value method:
Here, the p-value is greater than the level of significance.
That is,
Therefore, the null hypothesis is not rejected.
Thus, there is no evidence to infer that the first group is better than the second group.
b.
Check whether the samples are large enough to assume normality of
b.
Answer to Problem 46CE
No, the samples are not large enough to assume normality of
Explanation of Solution
Calculation:
Rule for normality:
- • Rule 1:
- • Rule 2:
- • Rule 3:
- • Rule 4:
Check the rule:
Rule 1:
Rule 2:
Rule 3:
Rule 4:
Since
c.
Make an argument that early-finishers should do better and then make the opposite argument.
Identify which is more convincing.
c.
Explanation of Solution
Early-finishers should do better because they know the good study material and notes.Therefore, the student complete the exam faster.
The opposite argument is the students might not know about how to collect the study materials and notes. Also, the students do not know the method of study. Therefore, the student completes the exam faster.
Hence, the argument that early-finishers should do better is more convincing.
Want to see more full solutions like this?
Chapter 10 Solutions
Applied Statistics in Business and Economics with Connect Access Card with LearnSmart


- Data from the 2014 General Social Survey (GSS) show that out of n=1,606 adult respondents, the proportion who reported having voted for Barack Obama in the 2008 presidential election was 0.61 Q: If I calculate a z test static of 4.84, and my alpha = 0.05, what decision should I make about the hypothesis? (Calculate the p-value for a 2-sided test to make your decision.) Options: A: fail to reject the null hypothesis that the proportion of American adults who voted for Obama in 2008 was 0.55 B: reject the null hypothesis that the proportion of American adults who voted for Obama in 2008 was 0.55 C: Reject the alternative hypothesis that the proportion of American Adults who voted for Obama in 2008 was not equal to 0.55 D: Fail to reject the alternative hypothesis that the proportion of American adults who voted for Obama in 2008 was not equal to 0.55arrow_forwardDr. Chapman conducted an experiment in which participants watched paint dry for 30 minutes twice, once being paid $1 and once being paid $30. When comparing the samples, he calculated t = 3.57. He assumed α = .01 with df = 5, so the tcv = ±4.032. Because the calculated value was: A. greater than the critical value, Dr. Chapman can reject the null hypothesis. B. greater than the critical value, Dr. Chapman failed to reject the null hypothesis. C. less than the critical value, Dr. Chapman failed to reject the null hypothesis. D. less than the critical value, Dr. Chapman can reject the null hypothesis.arrow_forwardA random sample of 50 students was asked to estimate how much money they spent on textbooks in a year. The sample skewness of these amounts was found to be 0.83 and the sample kurtosis was 3.98. Test at the 10% level the null hypothesis that the population dis- tribution of amounts spent is normal.arrow_forward
- A researcher obtains t=2.25 for a repeated measures study using a sample of n=10 participants. Based on this t value, what is the correct decision for a two- tail test at .05 and .01 alpha level?arrow_forwardA sample of n = 16 scores produces a t statistic of t = 2.00. If the sample is used to measure effect size with r2, what value will be obtained for r2?arrow_forwardThe desired percentage of SiO2 in a certain type of aluminous cement is 5.5. To test whether the true average percentage is 5.5 for a particular production facility, 16 independently obtained samples are analyzed. Suppose that the percentage of SiO2 in a sample is normally distributed with ? = 0.32 and that x = 5.21. (Use ? = 0.05.) (a) Does this indicate conclusively that the true average percentage differs from 5.5?State the appropriate null and alternative hypotheses. H0: ? = 5.5Ha: ? ≠ 5.5H0: ? = 5.5Ha: ? ≥ 5.5 H0: ? = 5.5Ha: ? < 5.5H0: ? = 5.5Ha: ? > 5.5 Calculate the test statistic and determine the P-value. (Round your test statistic to two decimal places and your P-value to four decimal places.) z = P-value = State the conclusion in the problem context. Do not reject the null hypothesis. There is sufficient evidence to conclude that the true average percentage differs from the desired percentage.Reject the null hypothesis. There is sufficient evidence…arrow_forward
- Consider the following: In general, when people diet they typically lose 10 lbs. (?σ = 2). A random sample of 16 people on the keto diet lost 15 lbs. Do people on the keto diet lose more or less weight than people on diets in general? 3. What is the Null Hypothesis? a)On average, weight loss in the keto diet sample does not differ from weight loss in the population of dieters in general. (H0: X-bar = Mu)) b)On average, weight loss in the keto diet sample does not differ from weight loss in the population of dieters in general. (H0: X-bar does not equal Mu) c)On average, weight loss in the keto diet sample differs from weight loss in the population of dieters in general. (H0: X-bar does not equal Mu) d)On average, weight loss in the keto diet sample differs from weight loss in the population of dieters in general. (H0: X-bar = Mu)arrow_forwardResearchers interested in lead exposure due to car exhaust sampled the blood of 52 police officers subjected to constant inhalation of automobile exhaust fumes while working traffic enforcement in a primarily urban environment. The blood samples of these officers had an average lead concentration of 124.32 µg/l and an SD of 37.74 µg/l; a previous study of individuals from a nearby suburb, with no history of exposure, found an average blood level concentration of 35 µg/l. Write down the hypotheses that would be appropriate for testing if the police officers appear to have been exposed to a higher concentration of lead. Explicitly state and check all conditions necessary for inference on these data. Test the hypothesis that the downtown police officers have a higher lead exposure than the group in the previous study. Interpret your results in context. Based on your preceding result, without performing a calculation, would a 99% confidence interval for the average blood concentration…arrow_forwardA survey of 90 recently delivered women on the rolls of a county welfare department revealed that 27 had a history of intrapartum or postpartum infection. Can we conclude that the population proportion with a history of intrapartum or postpartum infection is significantly less than or equal to 0.25? Let alpha = 0.05.arrow_forward
- . In general, a ____ t-statistic and a _____ p-value (relative to a chosen critical value and alpha) indicate that our estimated statistic is ____ to occur by chance if the null is true. a. Large; large; likely b. Small; large; likely c. Small; small; unlikely d. Large; large; likelyarrow_forwardA nationwide study of undergraduate students reported that the mean number of drinks consumed per week during the spring semester is 7.96. The mean number of drinks consumed per week at USC is 7.64 (s.d.=2.55, N=412 Health services is concerned that USC students are consuming significantly more alcohol per week than the national average. Using an alpha level of .05, Is there sufficient evidence to be concerned? Be sure to select the correct critical value for the alternative hypothesis, and then use this evidence to make your conclusionarrow_forwardIn an experiment, n = 35 are assigned to the control group, and n = 41 are assigned to the experimental group. What is the critical t value for alpha = .05, two-tailed test?arrow_forward
 Glencoe Algebra 1, Student Edition, 9780079039897...AlgebraISBN:9780079039897Author:CarterPublisher:McGraw Hill