
Videos
a.
State the hypotheses.
a.
Explanation of Solution
The given information is that the summary statistic for Sonando High School students is
Here, the direction of the test is right tailed.
Assume
State the hypotheses:
Null hypothesis:
That is, Sonando High School students did not choose fast-food restaurants more often than Gedacht High School.
Alternative hypothesis:
That is, Sonando High School students choose fast-food restaurants more often than Gedacht High School.
b.
Find the test statistic, assuming equal population variances.
b.
Answer to Problem 86CE
The test statistic is 2.513.
Explanation of Solution
Calculation:
The formula for test statistic is,
Where,
The pooled variance is,
The test statistic is,
Thus, the test statistic is 2.513.
c.
State the decision rule and the quick rule for degrees of freedom.
c.
Answer to Problem 86CE
The decision rule is “reject the null hypothesis, if
The degrees of freedom is 8.
Explanation of Solution
Calculation:
The degrees of freedom is,
Critical value:
Software procedure:
Step-by-step software procedure to obtain critical value using EXCEL is as follows:
- Open an EXCEL file.
- In cell A1, enter the formula “=T.INV(0.99, 25)”
- Output using Excel software is given below:
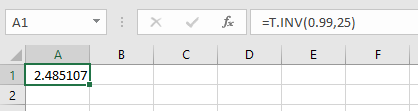
From the output, the critical value is 2.485.
Decision rule:
If
d.
State the conclusion.
d.
Answer to Problem 86CE
There is evidence to infer that Sonando High School students choose fast-food restaurants more often than Gedacht High School.
Explanation of Solution
Here, the test statistic is greater than the critical value.
That is,
Therefore, the null hypothesis is rejected.
Thus, there is evidence to infer that Sonando High School students choose fast-food restaurants more often than Gedacht High School.
e.
Check whether it is reasonable to assume equal variances.
e.
Answer to Problem 86CE
Yes, it is reasonable to assume equal variances.
Explanation of Solution
Calculation:
State the hypotheses:
Null hypothesis:
That is, the variances are equal.
Alternative hypothesis:
That is, the variances are not equal.
Degrees of freedom for numerator:
Degrees of freedom for denominator:
Level of significance:
Lower critical value:
Software procedure:
Step-by-step software procedure to obtain lower critical value using EXCEL is as follows:
- Open an EXCEL file.
- In cell A1, enter the formula “=F.INV(0.005,10,15)”
- Output using EXCEL is given below:
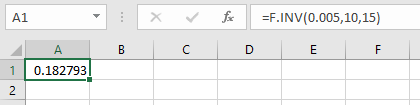
From the output, the critical value is
Upper critical value:
Software procedure:
Step-by-step software procedure to obtain upper critical value using EXCEL is as follows:
- Open an EXCEL file.
- In cell A1, enter the formula “=F.INV.RT(0.005,10,15)”
- Output using EXCEL is given below:
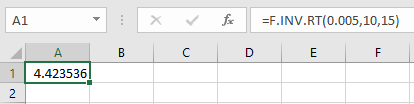
From the output, the critical value is
Decision rule:
- If
- If
Test statistic:
Thus, the test statistic is 1.023.
Conclusion:
Here, the test statistic is lies between lower and upper critical values.
That is,
Therefore, the null hypothesis is not rejected.
Thus, there is no evidence to infer that the variance has changed. That is, the population variances are equal.
Hence, it is reasonable to assume equal variances.
Want to see more full solutions like this?
Chapter 10 Solutions
Applied Statistics in Business and Economics with Connect Access Card with LearnSmart


- At the insistence of a government inspector, a new safety device is installed in an assembly-line operation. After the installation of this device, a random sample of 8 days’ output gave the following results for numbers of finished components produced:618 660 638 625 571 598 639 582Management is concerned about the variability of daily output and views any variance above 500 as undesirable. Test, at the 10% significance level, the null hypothesis that the population variance for daily output does not exceed 500.arrow_forwardIf the mean and variance are computed for each sample in an independent-measures two-factor experiment, then which types of sample data will tend to produce large F-ratios for the two-factor ANOVA? a. large differences between sample means and small sample variances b. large differences between sample means and large sample variances c. small differences between sample means and small sample variances d. small differences between sample means and large sample variancesarrow_forwardA sample of 60 items from population 1 has a sample variance of 8 while a sample of 40 items from population 2 has a sample variance of 14. If we test whether the variances of the two populations are equal, the test statistic will have a value ofarrow_forward
- Two samples of sizes 25 and 20 are independently drawn from two normal populations, where the unknown population variances are assumed to be equal. The number of degrees of freedom of the equal-variances t-test statistic is ?arrow_forward2) The table to the right shows the cost per ounce (in dollars) for a random sample of toothpastes exhibiting very good stain removal, good stain removal, and fair stain removal. At α=0.025, can you conclude that the mean costs per ounce are different? Perform a one-way ANOVA test by completing parts a through d. Assume that each sample is drawn from a normal population, that the samples are independent of each other, and that the populations have the same variances. Very good stain removal Good stain removal Fair stain removal 0.37 0.58 0.34 0.51 2.74 1.25 0.33 0.98 0.44 1.47 0.42 0.49 0.46 0.48 1.31 (a) Identify the claim and state H0 and Ha. Choose the correct answer below. A. H0: μ1=μ2=μ3=μ4=μ5=μ6 Ha: At least two means are different from the others. (claim) B. H0: At least one mean is different from the others. (claim) Ha: μ1=μ2=μ3=μ4=μ5=μ6 C. H0: μ1=μ2=μ3 Ha:…arrow_forwardPost-hoc tests are necessary for an analysis of variance comparing only two treatment conditions. t or farrow_forward
- A manager of a computer software store thinks that, even though the average number of buyers or clients is approximately the same as 5 years ago, the number of buyers or clients is more volatile that it was 5 years ago. In a sample of 26 weeks from 5 years ago, the standard deviation of buyers was 31 per week while in a sample of 21 weeks over the past year the standard deviation is 26 per week. Test the hypothesis at the 2.5% level of significance that the variance has increased from 5 years ago.arrow_forwardA carpet manufacturer is studying the differences between two of its major outlet stores. The company is interested in the time it takes for customers to receive carpeting that has been ordered from the plant. Data concerning a sample of delivery times for the most popular type of carpet are summarized as follows: Acme Store Betty’s Store x̄ 43.7 days 34.3 days s 3.1 days 2.4 days n 31 orders 41 orders Assuming equal variances, determine at the 5% level of significance, if there is enough evidence from the sample data to conclude that Acmes’ store must wait on average significantly longer for the carpet to be delivered than Betty’s store? Then calculate and interpret a (1-α)% CI for µA - µB. Does the interval estimate for µAcme - µBetty’s support the decision? Explain. Recall that we only use the p-value decision rule for 2 sample t-tests.arrow_forwardHistorically, the proportion of people who trade in their old car to a car dealer when purchasing a new car is 48%. Over the previous six months, in a sample of 115 new car buyers, 46 have traded in their old car. To determine (at the 10% level of significance) whether the proportion of new car buyers that trade in their old car has this is  statistically significantly decreased, what can you conclude concerning the null hypothesis? A) reject the null hypothesis Or B) fail to reject the null hypothesisarrow_forward
- Two different brands of milk are randomly sampled, and the fat content in each bottle is determined. Twenty-six bottles of Brand A yielded an average fat content of 26 grams with a standard deviation of 5 grams, and 31 bottles of Brand B yielded an average fat content of 25.8 grams with a standard deviation of 7 grams. Test the hypothesis at the 10% level of significance that the variances are different.arrow_forwardThe titanium content of steel is determined in two laboratories by means of atomic absorptionspectrometry. The following data were obtained: Lab 1 0.470 0.484 0.463 0.449 0.482 0.454 0.477 0.409 Lab 2 0.529 0.490 0.489 0.512 0.486 0.502 - - A. Determine the variance of the measurement data obtained in the two laboratories.B. Is there any significant difference between these variances?arrow_forward
 MATLAB: An Introduction with ApplicationsStatisticsISBN:9781119256830Author:Amos GilatPublisher:John Wiley & Sons Inc
 Probability and Statistics for Engineering and th...StatisticsISBN:9781305251809Author:Jay L. DevorePublisher:Cengage Learning
 Statistics for The Behavioral Sciences (MindTap C...StatisticsISBN:9781305504912Author:Frederick J Gravetter, Larry B. WallnauPublisher:Cengage Learning
 Elementary Statistics: Picturing the World (7th E...StatisticsISBN:9780134683416Author:Ron Larson, Betsy FarberPublisher:PEARSON
 The Basic Practice of StatisticsStatisticsISBN:9781319042578Author:David S. Moore, William I. Notz, Michael A. FlignerPublisher:W. H. Freeman
 Introduction to the Practice of StatisticsStatisticsISBN:9781319013387Author:David S. Moore, George P. McCabe, Bruce A. CraigPublisher:W. H. Freeman