
Concept explainers
Videos
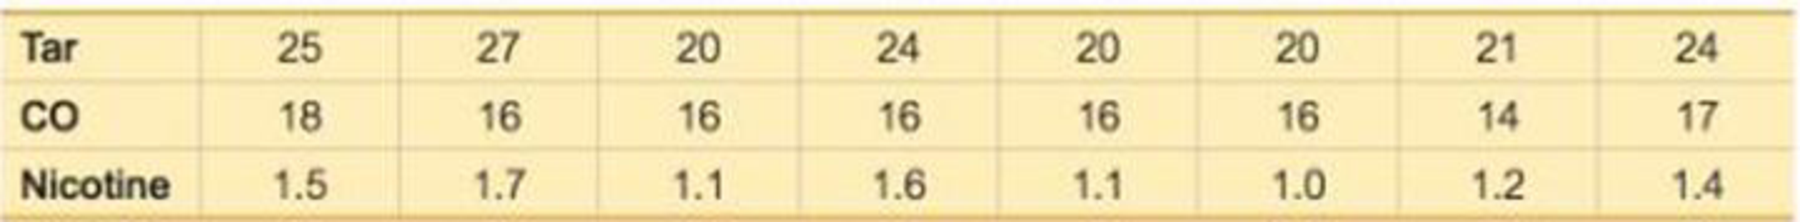
4. Multiple Regression with Cigarettes Use the sample data given in Review Exercise 1 “Cigarette Tar and Nicotine.”
a. Find the multiple regression equation with the response (y) variable of amount of nicotine and predictor (x) variables of amounts of tar and carbon monoxide.
b. Identify the value of the multiple coefficient of determination R2, the adjusted R2, and the P-value representing the overall significance of the multiple regression equation.
c. Use a 0.05 significance level and determine whether the regression equation can be used to predict the amount of nicotine given the amounts of tar and carbon monoxide.
d. The Raleigh brand king size cigarette is not included in the table, and it has 23 mg of tar and 15 mg of carbon monoxide. What is the best predicted amount of nicotine? How does the predicted amount compare to the actual amount of 13 mg of nicotine?
Want to see the full answer?
Check out a sample textbook solution
Chapter 10 Solutions
ELEMENTARY STATS. 18 WEEK ACCESS CODE


- Life Expectancy The following table shows the average life expectancy, in years, of a child born in the given year42 Life expectancy 2005 77.6 2007 78.1 2009 78.5 2011 78.7 2013 78.8 a. Find the equation of the regression line, and explain the meaning of its slope. b. Plot the data points and the regression line. c. Explain in practical terms the meaning of the slope of the regression line. d. Based on the trend of the regression line, what do you predict as the life expectancy of a child born in 2019? e. Based on the trend of the regression line, what do you predict as the life expectancy of a child born in 1580?2300arrow_forwardOlympic Pole Vault The graph in Figure 7 indicates that in recent years the winning Olympic men’s pole vault height has fallen below the value predicted by the regression line in Example 2. This might have occurred because when the pole vault was a new event there was much room for improvement in vaulters’ performances, whereas now even the best training can produce only incremental advances. Let’s see whether concentrating on more recent results gives a better predictor of future records. (a) Use the data in Table 2 (page 176) to complete the table of winning pole vault heights shown in the margin. (Note that we are using x=0 to correspond to the year 1972, where this restricted data set begins.) (b) Find the regression line for the data in part ‚(a). (c) Plot the data and the regression line on the same axes. Does the regression line seem to provide a good model for the data? (d) What does the regression line predict as the winning pole vault height for the 2012 Olympics? Compare this predicted value to the actual 2012 winning height of 5.97 m, as described on page 177. Has this new regression line provided a better prediction than the line in Example 2?arrow_forward3.4 SKILL BUILDING EXERCISES Getting Regression Lines Only Find the equation of the regression line for the following data set. x 1 2 3 y 3 3 4arrow_forward
 Functions and Change: A Modeling Approach to Coll...AlgebraISBN:9781337111348Author:Bruce Crauder, Benny Evans, Alan NoellPublisher:Cengage Learning
 College AlgebraAlgebraISBN:9781305115545Author:James Stewart, Lothar Redlin, Saleem WatsonPublisher:Cengage Learning
 Glencoe Algebra 1, Student Edition, 9780079039897...AlgebraISBN:9780079039897Author:CarterPublisher:McGraw Hill