
Concept explainers
Videos
It probably wouldn’t surprise you to know that Valentine’s Day means big business for florists, jewelry stores, and restaurants. But would it surprise you to know that it is also a big day for pet stores? In January 2010, the National Retail Federation conducted a survey of consumers who they believed were selected in a way that would produce a sample representative of the population of adults in the United States (“This Valentine’s Day, Couples Cut Back on Gifts to Each Other, According to NRF Survey,” nrf.com). One of the questions in the survey asked if the respondent planned to spend money on a Valentine’s Day gift for his or her pet this year.
- a. The proportion who responded that they did plan to purchase a gift for their pet was 0.173. Suppose that the
sample size for this survey was n = 200. Construct and interpret a 95% confidence interval for the proportion of all U.S. adults who planned to purchase a Valentine’s Day gift for their pet in 2010. - b. The actual sample size for the survey was much larger than 200. Would a 95% confidence interval computed using the actual sample size have been narrower or wider than the confidence interval computed in Part (a)?
- c. Still assuming a sample size of n = 200, carry out a hypothesis test to determine if the data provides convincing evidence that the proportion who planned to buy a Valentine’s Day gift for their pet in 2010 was greater than 0.15. Use a significance level of 0.05.
a.
Find the 95% confidence interval for the proportion of all adults of the Country U who planned to purchase a Valentine’s Day gift for their pet in 2010 and interpret it.
Answer to Problem 8CRE
The 95% confidence interval for the proportion of all adults of the Country U who planned to purchase a Valentine’s Day gift for their pet in 2010 is (0.121, 0.225).
Explanation of Solution
Calculation:
It was found that the proportion of respondents in the sample who responded that they planned to purchase a gift for their pets for Valentine’s Day of 2010 is 0.173. It is assumed that the sample size is 200.
The confidence interval for a population proportion p is appropriate in the following cases:
- The sample size is large, that is,
- The sample size is small relative to the population size, that is, the sample size should not be more than 10% of the population size.
- The sampling method is simple random sampling.
The general formula for finding the confidence interval for a population proportion p is as follows:
Here,
The proportion of people in the sample who responded that they did plan to purchase a gift for their pet is 0.173. That is, the sample proportion is, 0.173.
Check conditions:
Substitute
Although, the population size is not known, it is reasonable to assume that the sample size of 200 acts as the representative for all the respondents. It is also definite that the sample size is less than the 10% of the population of the adults of the Country U.
Since, the conditions are satisfied and the sample is large enough, it makes the confidence interval appropriate.
In this context, the number of respondents who plan to purchase a gift for their pet, x is not known. The value of x is obtained using the following calculation:
The sample proportion,
Where, x is the number of observations of interest and n is the sample size.
Substitute the corresponding values to get the sample proportion as follows:
The 95% confidence interval for proportion is calculated below:
Software procedure:
Step-by-step procedure to obtain the confidence interval using MINITAB software:
- Choose Stat > Basic statistics>1-Sample proportion.
- In Summarized data, enter Number of events as 35 and Number of trials as 200.
- Check Options, enter Confidence level as 95.
- Choose not equal in alternative hypothesis.
- Click OK in all dialogue boxes.
The output using the MINITAB software is given below:
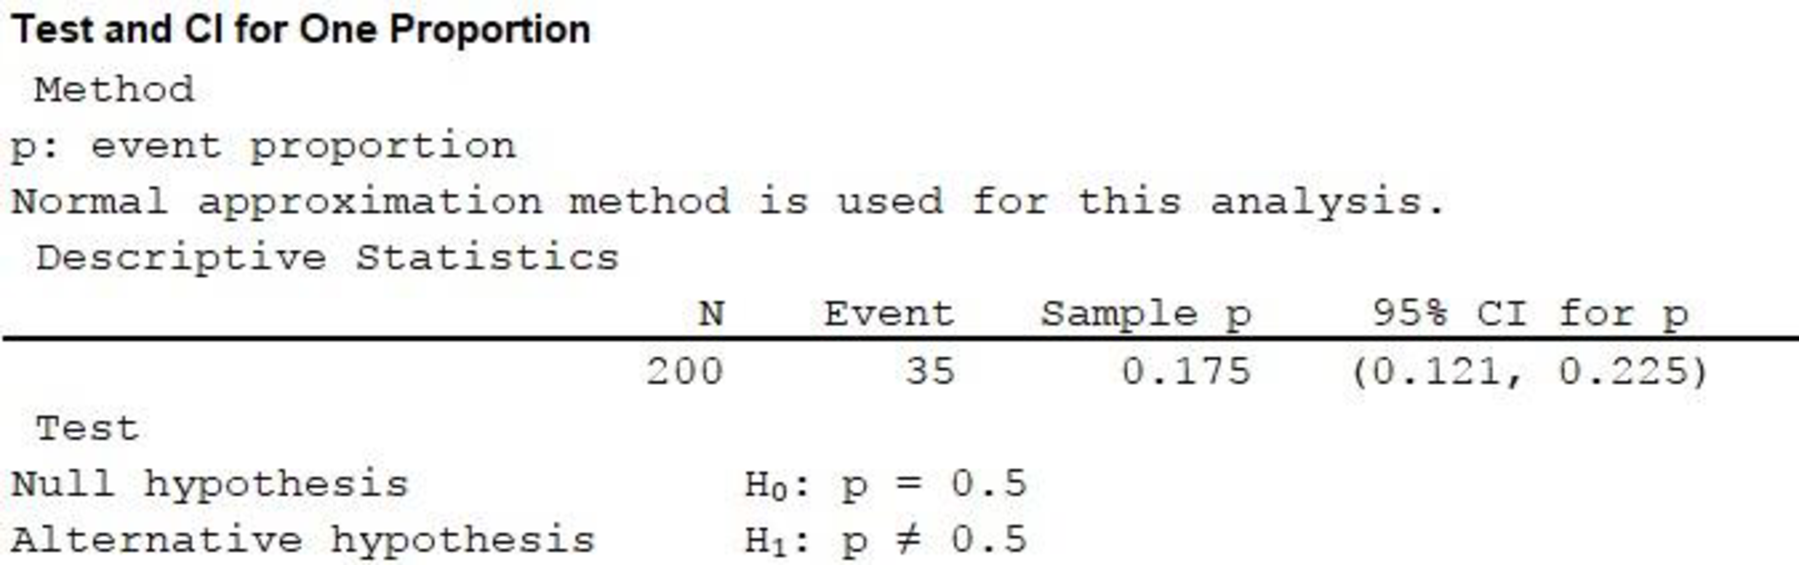
From the MINITAB output, the confidence interval is (0.121, 0.225).
Thus, the 95% confidence interval for the proportion of all adults of the Country U who planned to purchase a Valentine’s Day gift for their pet in 2010 is (0.121, 0.225).
Interpretation of confidence interval is “One can be 95% confident that the proportion of all adults of the Country U who planned to purchase a Valentine’s Day gift for their pet in 2010 is between 0.121 and 0.225”.
b.
Check whether a 95% confidence interval will be narrower or wider than the confidence interval given in Part (a), if the sample size is larger.
Answer to Problem 8CRE
The 95% confidence interval will be narrower than the confidence interval given in Part (a), if the sample size is larger.
Explanation of Solution
If the actual sample size for the survey is greater than that of the Part (a), then there will be more precise information about the sample, with 95% confidence.
Thus, a 95% confidence interval will be narrower than the confidence interval given in Part (a), if the sample size is larger.
c.
Check whether the sample data provide convincing evidence that the proportion of the adults of the Country U who planned to purchase a Valentine’s Day gift for their pet in 2010 is greater than 0.15.
Answer to Problem 8CRE
No, the sample data do not provide the evidence that the proportion of the adults of the Country U who planned to purchase a Valentine’s Day gift for their pet in 2010 is greater than 0.15.
Explanation of Solution
Calculation:
Step 1:
Population characteristic of interest:
Let p be the population characteristic of interest.
In this context, p denotes the population proportion of the adults of the Country U who planned to purchase a Valentine’s Day gift for their pet in 2010.
Step 2:
Null hypothesis:
That is, the proportion of the adults of the Country U who planned to purchase a Valentine’s Day gift for their pet in 2010 is 0.15.
Step 3:
Alternative hypothesis:
That is, the proportion of the adults of the Country U who planned to purchase a Valentine’s Day gift for their pet in 2010 is greater than 0.15.
Step 4:
Significance level,
It is given that the significance level,
Step 5:
Test statistic, z:
Where,
Substitute the hypothesized proportion,
Here, the sample proportion
Step 6:
Assumptions:
- Let
- The large sample z test can be used if the sample size n satisfies the conditions:
- The sample size should not be greater than 10% of the population size.
Requirement check:
- It is assumed that the sample is a random sample.
- Check the conditions:
Since
Therefore, the large sample z test is appropriate.
- Although, the population size is not known, it is reasonable to assume that the sample size of 200 acts as the representative for all the adults of the Country U. It is also definite that the sample size is less than the 10% of the population of the adults of the Country U.
Step 7:
The value of the test statistic is obtained as follows:
By substituting the value of sample proportion, the test statistic is obtained as follows:
Thus, the value of test statistic is 0.911.
Step 8:
P-value:
In this context, the alternative hypothesis denotes that the test carried out is right-tailed test. Therefore, the P-value is the area under the z curve and to the right of the calculated z value.
The P-value for the test statistic value of 0.91 is obtained as follows:
Use Standard Normal Probabilities (Cumulative z curve areas) table to find the z-value.
Procedure:
For z at 0.91:
· Locate 0.9 in the left column of the table.
· Obtain the value in the corresponding row below .01.
That is,
The P-value is obtained as follows:
Thus, the P-value for the test statistic of 0.91 is 0.1814.
Step 9:
Decision rule:
If
If
Here, the
That is,
The decision is that the null hypothesis is not rejected.
Conclusion:
Hence, the sample data do not provide the evidence that the proportion of the adults of the Country U who planned to purchase a Valentine’s Day gift for their pet in 2010 is greater than 0.15.
Want to see more full solutions like this?
Chapter 10 Solutions
INTRODUCTION TO STATISTICS & DATA ANALYS


- What is meant by the sample space of an experiment?arrow_forwardShow the sample space of the experiment: toss a fair coin three times.arrow_forwardAnswer the following questions. 3. When given two separate events, how do we know whether to apply the Addition Principle or the Multiplication Principle when calculating possible outcomes? What conjunctions may help to determine which operations to use?arrow_forward
 Glencoe Algebra 1, Student Edition, 9780079039897...AlgebraISBN:9780079039897Author:CarterPublisher:McGraw Hill
 Holt Mcdougal Larson Pre-algebra: Student Edition...AlgebraISBN:9780547587776Author:HOLT MCDOUGALPublisher:HOLT MCDOUGAL
 College Algebra (MindTap Course List)AlgebraISBN:9781305652231Author:R. David Gustafson, Jeff HughesPublisher:Cengage Learning