Concept explainers
Videos
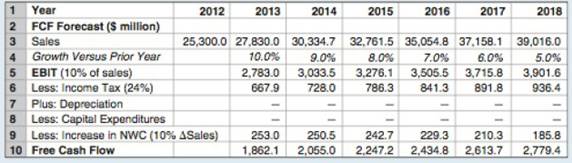
Consider the valuation of Nike given in Example 10.1.
a. Suppose you believe Nike's initial revenue growth rate will be between 7% and 11% (with growth always slowing linearly to 5% by year 2018). What range prices for Nike stock is consistent with these
b. Suppose you believe Nike's initial revenue EBIT margin will be between 9% and 11% of sales. What range of prices for Nike stock is consistent with these forecasts?
c. Suppose you believe Nike's weighted average cost of is between 9.5% and 12%. What range of prices for Nike stock is consistent with these forecasts?
d. What range of stock prices is consistent if you vary the estimates as in parts (a), (b), and (c) simultaneously?
Want to see the full answer?
Check out a sample textbook solution
Chapter 10 Solutions
MyLab Finance with Pearson eText -- Access Card -- for Fundamentals of Corporate Finance


- Investment advisors estimated the stock market returns for four market segments: computers, financial, manufacturing, and pharmaceuticals. Annual return projections vary depending on whether the general economic conditions are improving, stable, or declining. The anticipated annual return percentages for each market segment under each economic condition are as follows: Assume that an individual investor wants to select one market segment for a new investment. A forecast shows improving to declining economic conditions with the following probabilities: improving (0.2), stable (0.5), and declining (0.3). What is the preferred market segment for the investor, and what is the expected return percentage? At a later date, a revised forecast shows a potential for an improvement in economic conditions. New probabilities are as follows: improving (0.4), stable (0.4), and declining (0.2). What is the preferred market segment for the investor based on these new probabilities? What is the expected return percentage?arrow_forwardThe common stock of Manchester & Moore is expected to earn 16.2 percent in a recession, 8 percent in a normal economy, and lose 3.5 percent in a booming economy. The probability of a boom is 18 percent while the probability of a recession is 7 percent. What is the expected rate of return on this stock?arrow_forwardSuppose that two factors have been identified for the U.S. economy: the growth rate of industrial production, IP, and the inflation rate, IR. IP is expected to be 3%, and IR 3.4%. A stock with a beta of 2.8 on IP and 2.2 on IR currently is expected to provide a rate of return of 15%. If industrial production actually grows by 7%, while the inflation rate turns out to be 5.0%, what is your revised estimate of the expected return on the stock (write as percentage, rounded to one decimal place)?arrow_forward
- Suppose a firm has had the following historic sales figures. Year: 2016 2017 2018 2019 2020 Sales $1,530,000 $1,720,000 $1,560,000 $2,100,000 $1,850,000 What would be the forecast for next year’s sales using FORECAST.ETS to estimate a trend? Note: Round your answer to the nearest whole dollar.arrow_forward1.) Given this return data, the average realized return on Blue Llama Mining Inc.’s stock is _______ . 2.) The preceding data series represents a sample of Blue Llama’s historical returns. Based on this conclusion, the standard deviation of Blue Llama’s historical returns is _______ . 3.) If investors expect the average realized return on Blue Llama Mining Inc.’s stock from 2016 to 2020 to continue into the future, its expected coefficient of variation (CV) is expected to equal _______ .arrow_forwarda. Given the following holding-period returns, LOADING... , compute the average returns and the standard deviations for the Zemin Corporation and for the market. b. If Zemin's beta is 1.87 and the risk-free rate is 6 percent, what would be an expected return for an investor owning Zemin? (Note: Because the preceding returns are based on monthly data, you will need to annualize the returns to make them comparable with the risk-free rate. For simplicity, you can convert from monthly to yearly returns by multiplying the average monthly returns by 12.) c. How does Zemin's historical average return compare with the return you believe you should expect based on the capital asset pricing model and the firm's systematic risk? Month Zemin Corp. Market 1 5 % 6 % 2 2 1 3 2 0 4 −4 −1 5 4 3 6 3 4arrow_forward
- The expected market return is E(RM)is estimated to be 12% per annum, while the risk-free return (rf) is 3%. What is the expected return of Starbucks (SBUX) stock given the below beta estimate?arrow_forwardSuppose that two factors have been identified for the U.S. economy: the growth rate of industrial production, IP, and the inflation rate, IR. IP is expected to be 3%, and IR 5%. A stock with a beta of 1 on IP and .5 on IR currently is expected to provide a rate of return of 12%. If industrial production actually grows by 5%, while the inflation rate turns out to be 8%, what is your revised estimate of the expected rate of return on the stock?arrow_forward1.Blue Bell stock is expected to return 20% percent in a boom, 10% percent in a normal economy, and lose 2 percent in a recession. The probabilities of a boom, normal economy, and a recession are 7 percent, 89 percent, and 4 percent, respectively. What is the standard deviation of the returns on this stock?arrow_forward
- Suppose that the probability that the economy will be in a recession one year from now is 0.25. If the economy is in a recession one year from now the price of XYZ common stock will be $150. If the economy is not in a recession one year from now the price of XYZ common stock will be $200. If the current price of XYZ stock is $175, what is the standard deviation of the returns of XYZ common stock over the next year? Enter your answer as a percent without the “%”. Round your final answer to two decimals.arrow_forwardAssume the economy has an 6 percent chance of booming, am 8 percent chance of being recessionary, and being normal the remainder of the time. A stock is expected to return 22.5 percent in a boom, 11.5 percent in a normal economy, and −8 percent in a recession. What is the expected rate of return on this stock?arrow_forwardPlease, 1. Calculate the average stock return from 2005–2007, the standard deviation and coefficient of variation over this period. The market price of the stock was $31 at year-end 2004, $35 at year-end 2005, $42 at year-end 2006, and $55 at year-end 2007. For valuation purposes, industry experts use the dividend valuation model to value the common equity interest of industry firms. Potential investors’ required rate of return for this firm is 14 percent; growth rate is 13 percent for 2010 and 2011, and then declines to 12 percent for all later years. Market Returns: The stock returns for the market as a whole were as follows: 15.7 percent in 2005, 8.2 percent in 2006, and 12.1 percent in 2007arrow_forward
 Financial Reporting, Financial Statement Analysis...FinanceISBN:9781285190907Author:James M. Wahlen, Stephen P. Baginski, Mark BradshawPublisher:Cengage Learning
 EBK CONTEMPORARY FINANCIAL MANAGEMENTFinanceISBN:9781337514835Author:MOYERPublisher:CENGAGE LEARNING - CONSIGNMENT
 Essentials of Business Analytics (MindTap Course ...StatisticsISBN:9781305627734Author:Jeffrey D. Camm, James J. Cochran, Michael J. Fry, Jeffrey W. Ohlmann, David R. AndersonPublisher:Cengage Learning