
Videos
(a)
The level of significance, null and alternative hypothesis & determine whether we should use a left-tailed, right-tailed, or two-tailed test.
(a)
Answer to Problem 19P
Solution: The level of significance is
Explanation of Solution
The level of significance is defined as the probability of rejecting the null hypothesis when it is true, it is denoted by
Null hypothesis
Alternative hypothesis
Since
(b)
To find: The sampling distribution that should be used along with assumptions and compute the value of the sample test statistic.
(b)
Answer to Problem 19P
Solution: The sampling distribution of
Explanation of Solution
Calculation:
| A | B | |||
| 21 | 24 | -3 | 0.5625 | |
| 25 | 23 | 2 | 18.0625 | |
| 20 | 25 | -5 | 7.5625 | |
| 14 | 18 | -4 | 3.0625 | |
| -4 | 6 | -10 | 60.0625 | |
| 19 | 4 | 15 | 297.5625 | |
| 15 | 21 | -6 | 14.0625 | |
| 30 | 37 | -7 | 22.5625 | |
| Sum | 140 | 158 | -18 | 423.5 |
| Average | 17.5 | 19.75 | -2.25 | 52.9375 |
The d distribution is mound shaped and symmetrical and we have a random sample of
Using
(c)
To find: The critical value of the test statistic and sketch the sampling distribution showing the critical region.
(c)
Answer to Problem 19P
Solution: The critical value of the test statisticis
Explanation of Solution
Calculation:
The level of significance is
95% of the t-distribution curve lies between -
Using table 4 from Appendix we get
Critical region is
Graph:
To draw the required graphs using the Minitab, follow the below instructions:
Step 1: Go to the Minitab software.
Step 2: Go to Graph > Probability distribution plot > View probability.
Step 3: Select ‘t’ and d.f = 7.
Step 4: Click on the Shaded area > Probability.
Step 5: Select ‘Both tail’ and enter Probability as 0.05.
Step 6: Click on OK.
The obtained distribution graph is:
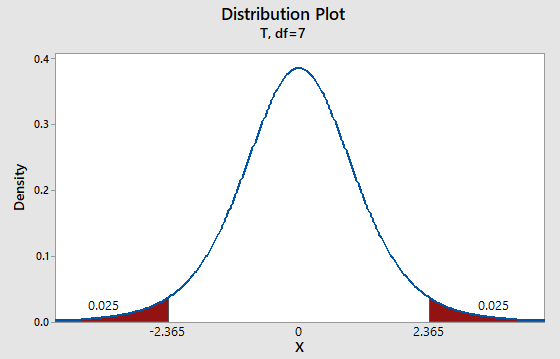
Interpretation:
If the value of the sample test statistics lies in the critical region then we have to reject the null hypothesis.
(d)
Whether we reject or fail to reject the null hypothesis and whether the data is statistically significant for a level of significance of 0.05.
(d)
Answer to Problem 19P
Solution: The t-value (- 0.82) does not lie in the critical region. The data is not statistically significant for a level of significance of 0.05
Explanation of Solution
The critical regionis
The t-value (- 0.82)does not lie in the critical region. Therefore we don’t have enough evidence to reject the null hypothesis
(e)
The interpretation for the conclusion.
(e)
Answer to Problem 19P
Solution: There is not enough evidence to conclude that the populations mean percentage increase in corporate revenue is different from the population mean percentage increase in CEO salary.
Explanation of Solution
The t-value (- 0.82) does not lie in the critical region. Therefore we don’t have enough evidence to reject the null hypothesis
(f)
The comparison for our conclusion with the conclusion obtained from the P-value method.
(f)
Answer to Problem 19P
Solution: Both the conclusions are same.
Explanation of Solution
The conclusion from the P-value method is:
The P-value of 0.4392 is greater than the level of significance (
Since we are using the same significance level of 0.05, hence both the conclusions will be same.
Want to see more full solutions like this?
Chapter 10 Solutions
Bundle: Understanding Basic Statistics, Loose-leaf Version, 7th + WebAssign Printed Access Card for Brase/Brase's Understanding Basic Statistics, ... for Peck's Statistics: Learning from Data


- Question 02 There is a claim that drink driving has been very common in high ways. The Highway Police randomly caught 300 drivers for breath alcohol test and found that 14% of drivers have breath alcohol over the legal limit. At 4% level of significance, use the p-value approach to test the hypothesis that the percentage of drivers who are drink driving is more than 10%.arrow_forwardMethod 4 of predicting children’s height These early, simple methods gave pediatricians and parents quick ways to estimate a child’s adult height, but they are not terribly accurate. A new statistical model was eventually developed based on age, weight, and parental height data from a large, longitudinal study. This method, called the Khamis-Roche method, can be applied only to healthy Caucasian children over the age of 4. To use this method, coefficients must be obtained from a table, multiplied by the corresponding measurement, and then added together with the constant to generate a formula to predict a child’s height. The partial tables that follow give the coefficients for girls aged 4 to 7. Write a formula for this method to predict the height of a 5-year-old girl, clearly defining any variables you use. Let C is child’s current height, W is the child’s current weight, and A is the average parent height. Use your formula to predict the adult height of a 5-year-old girl, if…arrow_forwardThe test statistic of z = -2.27 is obtained when testing the claim that p < 0.32 Part A: using a significance level a= 0.10, find the critical value(s)arrow_forward
- QUESTION 19 To study whether the students at a university are more or less satisfied with the current food service compared to the previous food service, a sample of 90 current students is taken and finds that 37 are satisfied with the current food service. A similar survey was taken for the previous food service in which 89 students surveyed found that 40 were satisfied with the previous food service. When testing the hypothesis (at the 5% level of significance) a higher percentage of students were satisfied with the previous food service than with the current food service, what is the test statistic? (please round your answer to 2 decimal places)arrow_forwardFor variables x1, x2, x3, and y satisfying the assumptions for multiple linear regression inferences, the population regression equation is y = 27 – 4.7x1 + 2.3x2 + 5.8x3. For samples of size 20 and given values of the predictor variables, the distribution of the estimates of β1 for all possible sample regression planes is a _________ distribution with mean _________ and standard deviation _______.arrow_forwardThe mean ±1 sd of ln [calcium intake (mg)] among 25females, 12 to 14 years of age, below the poverty level is6.56 ± 0.64. Similarly, the mean ± 1 sd of ln [calcium intake(mg)] among 40 females, 12 to 14 years of age, above thepoverty level is 6.80 ± 0.76. A.What is the appropriate procedure to test for a significant difference in means between the two groups?B. Implement the procedure in Problem 8.3 using theD.critical-value method.C. What is the p-value corresponding to your answer toProblem 8.4? Compute a 95% CI for the difference in meansbetween the two groups.arrow_forward
- In a neighborhood of 150 homes, a survey of 45 homes found that the average number of pets was 2.1 (SD=0.75). The city-wide average for neighborhoods is 2.5 pets. Find the critical value of t and the value of t we obtain (or observe) presuming a 2-tailed test. Also calculate the effect size. Finally, write up a 1 paragraph summary, of the findings starting with a statement of the hypotheses. Include all relevant information in your summary given this minimal information.arrow_forwardQuestion 2 Ignore the term "maximum likelihood"arrow_forwardWhen you have means from two different samples, it is best to conduct ______. 1 - dependent samples t test 2 - one-sample t test 3- ANOVA 4- independent samples t testarrow_forward
- When we use a least-squares line to predict y values for x values beyond the range of x values found in the data, are we extrapolating or interpolating? Are there any concerns about such predictions?arrow_forwardThese early, simple methods gave pediatricians and parents quick ways to estimate a child’s adult height, but they are not terribly accurate. A new statistical model was eventually developed based on age, weight, and parental height data from a large, longitudinal study. This method, called the Khamis-Roche method, can be applied only to healthy Caucasian children over the age of 4. To use this method, coefficients must be obtained from a table, multiplied by the corresponding measurement, and then added together with the constant to generate a formula to predict a child’s height. The partial tables that follow give the coefficients for girls aged 4 to 7. Write a formula for this method to predict the height of a 5-year-old girl, clearly defining any variables you use. Let C is child’s current height, W is the child’s current weight, and A is the average parent height. Use your formula to predict the adult height of a 5-year-old girl, if her current height is 3’6’’ and her weight is…arrow_forwardfor a given disease gene, specified mode of inheritance, and observed data set, if the p-value for a chi-square goodness of fit analysis is 0.01, then we: a) reject the null hypothesis at the 0.0001 level. b) reject the null hypothesis that the disease does not follow the specified mode of inheritance at the given gene. c) accept the null hypothesis that the disease almost certainly follows the specified mode of inheritance at the given gene. d) reject the null hypothesis that the disease follows the specified mode of inheritance at the given gene. e) cannot answer the question.arrow_forward
 MATLAB: An Introduction with ApplicationsStatisticsISBN:9781119256830Author:Amos GilatPublisher:John Wiley & Sons Inc
 Probability and Statistics for Engineering and th...StatisticsISBN:9781305251809Author:Jay L. DevorePublisher:Cengage Learning
 Statistics for The Behavioral Sciences (MindTap C...StatisticsISBN:9781305504912Author:Frederick J Gravetter, Larry B. WallnauPublisher:Cengage Learning
 Elementary Statistics: Picturing the World (7th E...StatisticsISBN:9780134683416Author:Ron Larson, Betsy FarberPublisher:PEARSON
 The Basic Practice of StatisticsStatisticsISBN:9781319042578Author:David S. Moore, William I. Notz, Michael A. FlignerPublisher:W. H. Freeman
 Introduction to the Practice of StatisticsStatisticsISBN:9781319013387Author:David S. Moore, George P. McCabe, Bruce A. CraigPublisher:W. H. Freeman