
Concept explainers
Videos
Testing for a
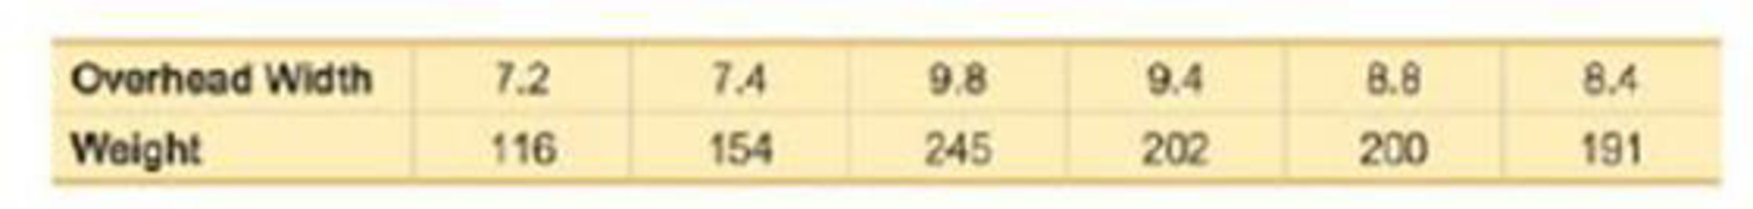
23. Weighing Seals with a Camera Listed below are the overhead widths (cm) of seals measured from photographs and the weights (kg) of the seals (based on “Mass Estimation of Weddell Seals Using Techniques of Photogrammetry” by R. Garrott of Montana State University). The purpose of the study was to determine if weights of seals could he determined from overhead photographs. Is there sufficient evidence to conclude that there is a linear correlation between overhead widths of seals from photographs and the weights of the seals?
Want to see the full answer?
Check out a sample textbook solution
Chapter 10 Solutions
Essentials of Statistics Plus MyLab Statistics with Pearson eText -- Access Card Package (6th Edition) (What's New in Statistics)


- Testing for a Linear Correlation. In Exercises 13–28, construct a scatterplot, and find the value of the linear correlation coefficient r. Also find the P-value or the critical values of r from Table A-6. Use a significance level of α = 0.05. Determine whether there is sufficient evidence to support a claim of a linear correlation between the two variables. (Save your work because the same data sets will be used in Section 10-2 exercises.) Pizza and the Subway The “pizza connection” is the principle that the price of a slice of pizza in New York City is always about the same as the subway fare. Use the data listed below to determine whether there is a significant linear correlation between the cost of a slice of pizza and the subway fare.arrow_forwardTesting for a Linear Correlation. In Exercises 13–28, construct a scatterplot, and find the value of the linear correlation coefficient r. Also find the P-value or the critical values of r from Table A-6. Use a significance level of α = 0.05. Determine whether there is sufficient evidence to support a claim of a linear correlation between the two variables. (Save your work because the same data sets will be used in Section 10-2 exercises.) Tips Listed below are amounts of bills for dinner and the amounts of the tips that were left. The data were collected by students of the author. Is there sufficient evidence to conclude that there is a linear correlation between the bill amounts and the tip amounts? If everyone were to tip with the same percentage, what should be the value of r?arrow_forward
 Calculus For The Life SciencesCalculusISBN:9780321964038Author:GREENWELL, Raymond N., RITCHEY, Nathan P., Lial, Margaret L.Publisher:Pearson Addison Wesley,
 Big Ideas Math A Bridge To Success Algebra 1: Stu...AlgebraISBN:9781680331141Author:HOUGHTON MIFFLIN HARCOURTPublisher:Houghton Mifflin Harcourt
 Glencoe Algebra 1, Student Edition, 9780079039897...AlgebraISBN:9780079039897Author:CarterPublisher:McGraw Hill