Concept explainers
Videos
Testing for a
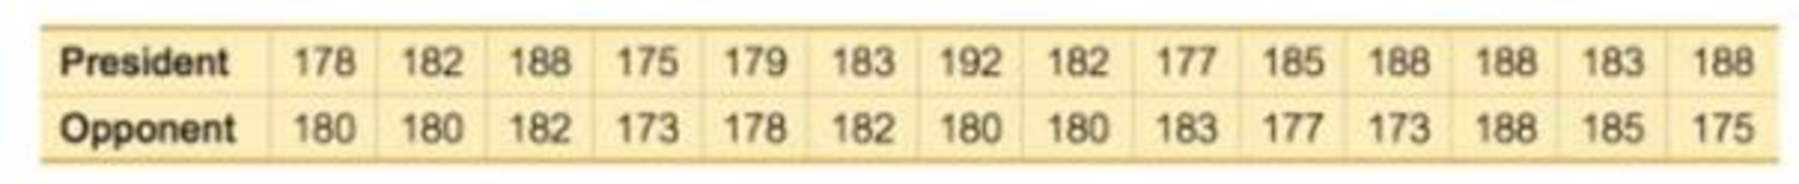
26. POTUS Media periodically discuss the issue of heights of winning presidential candidates and heights of their main opponents. Listed below are those heights (cm) from several recent presidential elections (from Data Set 15 “Presidents” in Appendix B). Is there sufficient evidence to conclude that there is a linear correlation between heights of winning presidential candidates and heights of their main opponents? Should there be such a correlation?
Want to see the full answer?
Check out a sample textbook solution
Chapter 10 Solutions
Essentials of Statistics, Books a la Carte Edition (6th Edition)


- Testing for a Linear Correlation. In Exercises 13–28, construct a scatterplot, and find the value of the linear correlation coefficient r. Also find the P-value or the critical values of r from Table A-6. Use a significance level of α = 0.05. Determine whether there is sufficient evidence to support a claim of a linear correlation between the two variables. (Save your work because the same data sets will be used in Section 10-2 exercises.) Old Faithful Listed below are duration times (seconds) and time intervals (min) to the next eruption for randomly selected eruptions of the Old Faithful geyser in Yellowstone National Park. Is there sufficient evidence to conclude that there is a linear correlation between duration times and interval after times?arrow_forwardTesting for a Linear Correlation. In Exercises 13–28, construct a scatterplot, and find the value of the linear correlation coefficient r. Also find the P-value or the critical values of r from Table A-6. Use a significance level of α = 0.05. Determine whether there is sufficient evidence to support a claim of a linear correlation between the two variables. (Save your work because the same data sets will be used in Section 10-2 exercises.) Manatees Listed below are numbers of registered pleasure boats in Florida (tens of thousands) and the numbers of manatee fatalities from encounters with boats in Florida for each of several recent years. The values are from Data Set 10 “Manatee Deaths” in Appendix B. Is there sufficient evidence to conclude that there is a linear correlation between numbers of registered pleasure boats and numbers of manatee boat fatalities?arrow_forward
 Calculus For The Life SciencesCalculusISBN:9780321964038Author:GREENWELL, Raymond N., RITCHEY, Nathan P., Lial, Margaret L.Publisher:Pearson Addison Wesley,
 Big Ideas Math A Bridge To Success Algebra 1: Stu...AlgebraISBN:9781680331141Author:HOUGHTON MIFFLIN HARCOURTPublisher:Houghton Mifflin Harcourt
 Glencoe Algebra 1, Student Edition, 9780079039897...AlgebraISBN:9780079039897Author:CarterPublisher:McGraw Hill