Testing for a Linear Correlation . In Exercises 13–28, construct a scatterplot , and find the value of the linear correlation coefficient r. Also find the P-value or the critical values of r from Table A-6. Use a significance level of α = 0.05. Determine whether there is sufficient evidence to support a claim of a linear correlation between the two variables. (Save your work because the same data sets will be used in Section 10-2 exercises.) 27. Sports Diameters (cm), circumferences (cm), and volumes (cm 3 ) from balls used in different sports are listed in the table below. Is there sufficient evidence to conclude that there is a linear correlation between diameters and circumferences? Does the scatterplot confirm a linear association?
Testing for a Linear Correlation . In Exercises 13–28, construct a scatterplot , and find the value of the linear correlation coefficient r. Also find the P-value or the critical values of r from Table A-6. Use a significance level of α = 0.05. Determine whether there is sufficient evidence to support a claim of a linear correlation between the two variables. (Save your work because the same data sets will be used in Section 10-2 exercises.) 27. Sports Diameters (cm), circumferences (cm), and volumes (cm 3 ) from balls used in different sports are listed in the table below. Is there sufficient evidence to conclude that there is a linear correlation between diameters and circumferences? Does the scatterplot confirm a linear association?
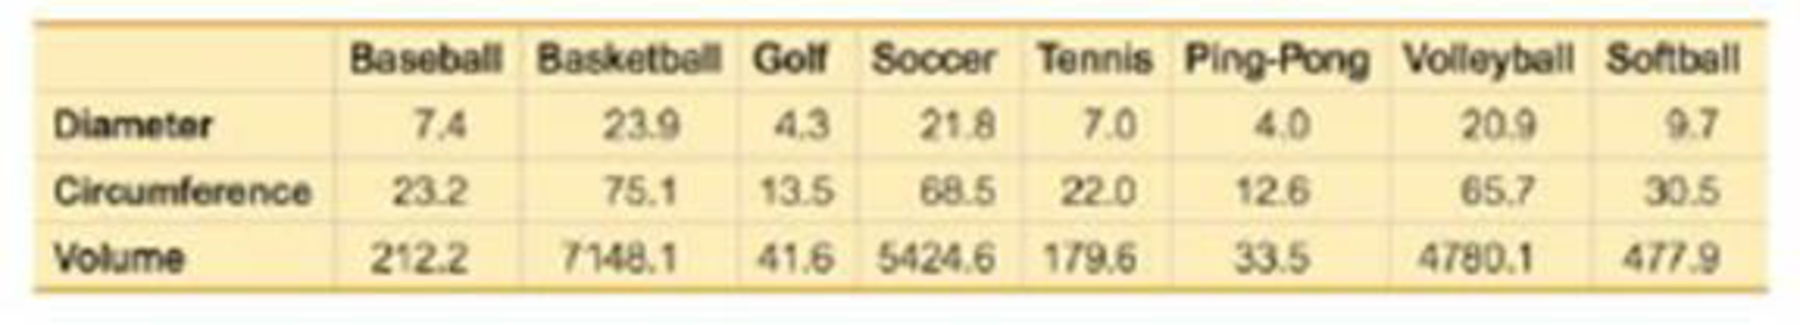
Solution Summary: The author explains how the scatterplot confirms a linear association between the diameters and circumferences using the MINITAB software.
Testing for a Linear Correlation. In Exercises 13–28, construct a scatterplot, and find the value of the linear correlation coefficient r. Also find the P-value or the critical values of r from Table A-6. Use a significance level of α = 0.05. Determine whether there is sufficient evidence to support a claim of a linear correlation between the two variables. (Save your work because the same data sets will be used in Section 10-2 exercises.)
27. Sports Diameters (cm), circumferences (cm), and volumes (cm3) from balls used in different sports are listed in the table below. Is there sufficient evidence to conclude that there is a linear correlation between diameters and circumferences? Does the scatterplot confirm a linear association?
Definition Definition Statistical measure used to assess the strength and direction of relationships between two variables. Correlation coefficients range between -1 and 1. A coefficient value of 0 indicates that there is no relationship between the variables, whereas a -1 or 1 indicates that there is a perfect negative or positive correlation.
Need a deep-dive on the concept behind this application? Look no further. Learn more about this topic, statistics and related others by exploring similar questions and additional content below.
Correlation Vs Regression: Difference Between them with definition & Comparison Chart; Author: Key Differences;https://www.youtube.com/watch?v=Ou2QGSJVd0U;License: Standard YouTube License, CC-BY
Correlation and Regression: Concepts with Illustrative examples; Author: LEARN & APPLY : Lean and Six Sigma;https://www.youtube.com/watch?v=xTpHD5WLuoA;License: Standard YouTube License, CC-BY


 Big Ideas Math A Bridge To Success Algebra 1: Stu...AlgebraISBN:9781680331141Author:HOUGHTON MIFFLIN HARCOURTPublisher:Houghton Mifflin Harcourt
 Glencoe Algebra 1, Student Edition, 9780079039897...AlgebraISBN:9780079039897Author:CarterPublisher:McGraw Hill