
Videos
(a)
Find the level of significance.
State the null and alternative hypothesis.
(a)
Answer to Problem 9P
The level of significance is 0.05.
Explanation of Solution
Calculation:
From the given information the value of
Hence, the level of significance is 0.05.
The null and alternative hypothesis is,
Null hypothesis:
Alternative hypothesis:
(b)
Find the value of the chi-square statistic for the sample.
Check whether the expected frequencies for all cells greater than 5 or not.
Identify the sampling distribution to be used.
Find the degrees of freedom.
(b)
Answer to Problem 9P
The value of the chi-square statistic for the sample is 8.649.
Yes, all the expected frequencies are greater than 5.
The chi-square distribution is used.
The degrees of freedom are 2.
Explanation of Solution
Calculation:
Test statistic:
The sample chi-square test statistic is,
In the formula O is the observed frequency, E is the expected frequency, with degrees of freedom
The expected values are,
| Occupation | Personality Preference Type | Row Total | |
| E | I | ||
| Clergy (all denominations) | 107 | ||
| M.D. | 162 | ||
| Lawyer | 137 | ||
| Column Total | 186 | 220 | 406 |
It is clear that all the expected values are greater than 5, this shows that the chi-square distribution can be used. There are 3 rows and 2 columns.
The value of the chi-square statistic for the sample is,
Hence, the value of the chi-square statistic for the sample is 8.649.
Substitute 3 for R, and 2 for C in the degrees of freedom formula.
Hence, the degrees of freedom are 2.
(c)
Find the P-value of the sample test statistic.
(c)
Answer to Problem 9P
The P-value is 0.0132.
Explanation of Solution
Calculation:
Step by step procedure to obtain P-value using MINITAB software is given below:
- Choose Graph > Probability Distribution Plot choose View Probability > OK.
- From Distribution, choose ‘Chi-Square’ distribution.
- In Degrees of freedom, enter the value as 2.
- Click the Shaded Area tab.
- Choose X Value and Right Tail, for the region of the curve to shade.
- Enter the X value as 8.649.
- Click OK.
Output using MINITAB software is given below:
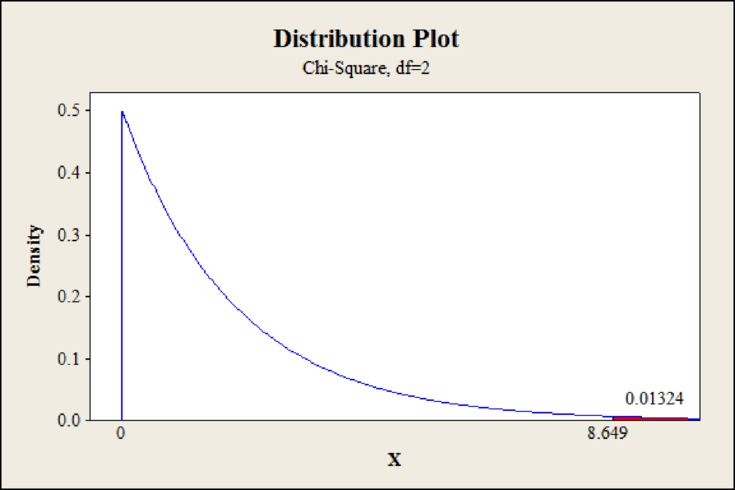
From Minitab output, the P-value is 0.0132.
Hence, the P-value is 0.0132.
(d)
Check whether the null hypothesis of independence is rejected or fail to reject.
(d)
Answer to Problem 9P
The null hypothesis of independence is rejected.
Explanation of Solution
Calculation:
From part (c), the P-value is 0.0132.
Rejection rule:
- If the P-value is less than or equal to
Conclusion:
The P-value is 0.0132 and the level of significance is 0.05.
The P-value is less than the level of significance.
That is,
By the rejection rule, the null hypothesis is rejected.
Hence, the null hypothesis of independence is rejected.
(e)
Interpret the conclusion in the context of the application.
(e)
Explanation of Solution
Calculation:
From part (d), the null hypothesis is rejected. This shows that, there is sufficient evidence that the variables occupations and personality preferences are not independent at level of significance 0.05.
Want to see more full solutions like this?
Chapter 10 Solutions
Bundle: Understandable Statistics: Concepts And Methods, 12th + Webassign, Single-term Printed Access Card


- For problem 1, perform the hypothesis test. 1) Bob grows pumpkins. He claims that the average weight of his pumpkins is greater than 5.6 lbs. Test his claim if a simple random sample was collected when: the mean of the x scores = 5.9, standard deviation = .3 lb, and the sample size = 81.arrow_forwardThe closer the numerator of a t-test gets to zero, the more likely it is that there is no statistically significant difference between the two means we are testing. True Falsearrow_forwardQuestions 6–10 refer to the sample data in the following table, which describes the fate of the passengers and crew aboard the Titanic when it sank on April 15, 1912. Assume that the data are a sample from a large population and we want to use a 0.05 significance level to test the claim that surviving is independent of whether the person is a man, woman, boy, or girl. Identify the null and alternative hypotheses corresponding to the stated claim.arrow_forward
- If your question is that your significant hypothesis test is significant “enough” to have true meaning, what are some other things you can look at to determine practical significance?arrow_forwardIn the picture there is a given data and based from that data. There is no significant difference between the perceived level of riskiness of thrill behavior in males and in females. (Use a= 0.05) Identify the Null hypothesis and Alternative Hypothesisarrow_forwardIf the proportion of the population in City A that is over 65 years old is p1 and the proportion of the population in City B that is over 65 years old is p2, what is the null hypothesis for a test to determine if the proportion of the population that is over 65 years old is greater in City A? Select the correct answer below: H0: p1−p2=0 H0: p1−p2>0 H0: p1−p2<0 H0: p1−p2≠0arrow_forward
- For all problems provide the following as warranted. SHOW ALL WORK: Null hypothesis; Alternative hypothesis; appropriate variables such as variance, sample mean etc; a sketch of the normal distribution curve with the appropriate critical value(s), critical (reject) area(s), and test value shown; a written statement on whether the null hypothesis is to be reject based on the provided evidence. Please ask for clarification on these directions if needed. 3) The number of students who belong to the dance company at each of several randomly selected small universities is shown here. Estimate the true population mean size of a university dance company with 99% confidence.21 25 32 22 28 30 29 30 40 47 26 35 26 35 28 28 32 27arrow_forwardFor each of the following situations, state whether you would use a chi-square goodness-of-fit test, a chi-square test of homogeneity, a chi-square test of independence, or some other statistical test. Complete parts a) through c) below. a) Is the quality of a car affected by what day it was built? A car manufacturer examines a random sample of the warranty claims filed over the past two years to test whether defects are randomly distributed across days of the work week. Choose the correct answer below. A. Chi-square test of independence. You have data on two variables, day and quality, for one manufacturer. B. Chi-square goodness-of-fit test. You want to see if the distribution of defects is uniform over the variable day. C. Chi-square test of homogeneity. You have two samples and one variable, day. You want to see if the distribution of quality is the same in the two years. D. Some other statistical test. The variable day is…arrow_forwardNeed answers for these questions . Using the Chi-square statistical tablearrow_forward
- For the following pairs of assertions, indicate which do not comply with our rules for setting up hypotheses and why (the subscripts 1 and 2 differentiate between quantities for two different populations or samples):arrow_forwardFor each of the following hypothetical analyses, decide whether the appropriate test is binomial, goodness of fit, or independence. Then give the appropriate null and alternative hypothesis in words. (Note that binomial tests can be considered a special form of GOF, but if the binomial test can be performed, call it binomial and render the null and alternative hypotheses in symbols, instead.) a) Respondents to a survey indicate whether they Agree, Disagree, or Don’t Know that a carbon tax would help reduce greenhouse gas emissions. A researcher wants to know if such opinions are affected by what political party people belong to. b) At hospital births, the attendant rates the newborn 1 minute after birth with a number called the Apgar score, on a scale of 1 to 10. Scores of 7 or above are considered normal, and scores of 6 or below indicate that babies need immediate medical attention, such as airway clearance. Suppose you wish to test the proposition that the race of the mother does…arrow_forwardWe want to compare cholesterol levels between men and women, so we collect a sample of 20 women and 30 men. The group of men in our sample have a mean of 240.0 with standard deviation 35.0, and the women have a mean of 210.0 with standard deviation 30.0. What is the null hypothesis? Note that two-sample problems (like this one) were not discussed in class, but you should know the answer (or at least be able to provide a good guess below) based on what was covered in class. Group of answer choices The mean cholesterol level in men is equal to the mean cholesterol level in women The mean cholesterol level in men is different than the mean cholesterol level in women The mean cholesterol level in men is less than the mean cholesterol level in women The mean cholesterol level in men is less than the mean cholesterol level in womenarrow_forward
 MATLAB: An Introduction with ApplicationsStatisticsISBN:9781119256830Author:Amos GilatPublisher:John Wiley & Sons Inc
 Probability and Statistics for Engineering and th...StatisticsISBN:9781305251809Author:Jay L. DevorePublisher:Cengage Learning
 Statistics for The Behavioral Sciences (MindTap C...StatisticsISBN:9781305504912Author:Frederick J Gravetter, Larry B. WallnauPublisher:Cengage Learning
 Elementary Statistics: Picturing the World (7th E...StatisticsISBN:9780134683416Author:Ron Larson, Betsy FarberPublisher:PEARSON
 The Basic Practice of StatisticsStatisticsISBN:9781319042578Author:David S. Moore, William I. Notz, Michael A. FlignerPublisher:W. H. Freeman
 Introduction to the Practice of StatisticsStatisticsISBN:9781319013387Author:David S. Moore, George P. McCabe, Bruce A. CraigPublisher:W. H. Freeman