
Understandable Statistics: Concepts and Methods
12th Edition
ISBN: 9781337119917
Author: Charles Henry Brase, Corrinne Pellillo Brase
Publisher: Cengage Learning
expand_more
expand_more
format_list_bulleted
Videos
Textbook Question
Chapter 10.2, Problem 10P
For Problems 5–16, please provide the following information.
- (a) What is the level of significance? State the null and alternate hypotheses.
- (b) Find the value of the chi-square statistic for the sample. Are all the expected frequencies greater than 5? What sampling distribution will you use? What are the degrees of freedom?
- (c) Find or estimate the P-value of the sample test statistic.
- (d) Based on your answers in parts (a) to (c), will you reject or fail to reject the null hypothesis that the population fits the specified distribution of categories?
- (e) Interpret your conclusion in the context of the application.
Meteorology:
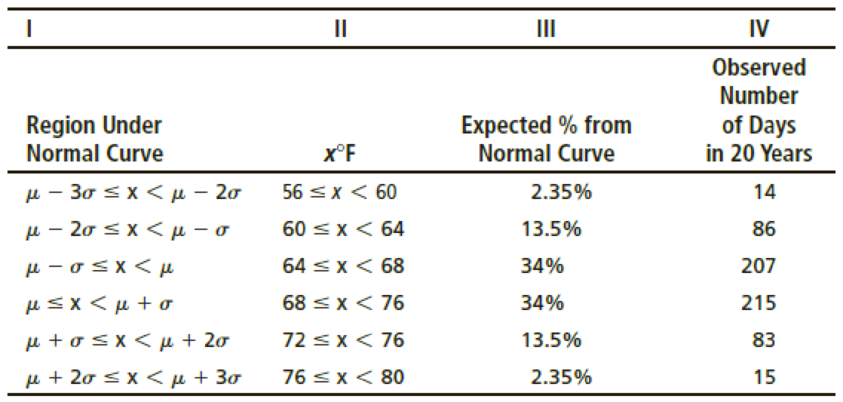
- (i) Remember that μ = 68 and σ = 4. Examine Figure 6-5 in Chapter 6. Write a brief explanation for Columns I, II, and III in the context of this problem.
- (ii) Use a 1% level of significance to test the claim that the average daily January temperature follows a normal distribution with μ = 68 and σ = 4.
Expert Solution & Answer

Trending nowThis is a popular solution!

Students have asked these similar questions
For problem 1, perform the hypothesis test.
1) Bob grows pumpkins. He claims that the average weight of his pumpkins is greater than 5.6 lbs. Test his claim if a simple random sample was collected when: the mean of the x scores = 5.9, standard deviation = .3 lb, and the sample size = 81.
Answer the Following Questions for no. 1 and show your clear solutions:
A. Getting statistic from a parameter of 800, sampling error of 1% and largest possible proportion of 50%. What is the sample size?
B. What is the target sample size for a population of 4,500 people with a standard value of 1.75 and a sampling error of 15%?
Questions 6–10 refer to the sample data in the following table, which describes the fate of the passengers and crew aboard the Titanic when it sank on April 15, 1912. Assume that the data are a sample from a large population and we want to use a 0.05 significance level to test the claim that surviving is independent of whether the person is a man, woman, boy, or girl.
Given that the P -value for the hypothesis test is 0.000 when rounded to three decimal places, what do you conclude? What do the results indicate about the rule that women and children should be the first to be saved?
Chapter 10 Solutions
Understandable Statistics: Concepts and Methods
Ch. 10.1 - Statistical Literacy In general, are chi-square...Ch. 10.1 - Statistical Literacy For chi-square distributions,...Ch. 10.1 - Prob. 3PCh. 10.1 - Prob. 4PCh. 10.1 - Prob. 5PCh. 10.1 - Prob. 6PCh. 10.1 - Prob. 7PCh. 10.1 - Interpretation: Test of Independence Consider...Ch. 10.1 - Prob. 9PCh. 10.1 - For Problems 919, please provide the following...
Ch. 10.1 - Prob. 11PCh. 10.1 - For Problems 919, please provide the following...Ch. 10.1 - Prob. 13PCh. 10.1 - Prob. 14PCh. 10.1 - Prob. 15PCh. 10.1 - Prob. 16PCh. 10.1 - Prob. 17PCh. 10.1 - For Problems 919, please provide the following...Ch. 10.1 - Prob. 19PCh. 10.2 - Statistical Literacy For a chi-square...Ch. 10.2 - Prob. 2PCh. 10.2 - Statistical Literacy Explain why goodness-of-fit...Ch. 10.2 - Prob. 4PCh. 10.2 - For Problems 516, please provide the following...Ch. 10.2 - For Problems 516, please provide the following...Ch. 10.2 - Prob. 7PCh. 10.2 - For Problems 516, please provide the following...Ch. 10.2 - For Problems 516, please provide the following...Ch. 10.2 - For Problems 516, please provide the following...Ch. 10.2 - For Problems 516, please provide the following...Ch. 10.2 - For Problems 516, please provide the following...Ch. 10.2 - For Problems 516, please provide the following...Ch. 10.2 - Prob. 14PCh. 10.2 - Prob. 15PCh. 10.2 - Prob. 16PCh. 10.2 - Prob. 17PCh. 10.2 - Prob. 18PCh. 10.3 - Statistical Literacy Does the x distribution need...Ch. 10.3 - Critical Thinking The x distribution must be...Ch. 10.3 - Prob. 3PCh. 10.3 - For Problems 311, please provide the following...Ch. 10.3 - For Problems 311, please provide the following...Ch. 10.3 - For Problems 311, please provide the following...Ch. 10.3 - For Problems 311, please provide the following...Ch. 10.3 - For Problems 311, please provide the following...Ch. 10.3 - For Problems 311, please provide the following...Ch. 10.3 - For Problems 311, please provide the following...Ch. 10.3 - Prob. 11PCh. 10.4 - Prob. 1PCh. 10.4 - Statistical Literacy When using the F distribution...Ch. 10.4 - Prob. 3PCh. 10.4 - Prob. 4PCh. 10.4 - Prob. 5PCh. 10.4 - Prob. 6PCh. 10.4 - Prob. 7PCh. 10.4 - Prob. 8PCh. 10.4 - Prob. 9PCh. 10.4 - For Problems 512, please provide the following...Ch. 10.4 - Prob. 11PCh. 10.4 - Prob. 12PCh. 10.5 - In each problem, assume that the distributions are...Ch. 10.5 - Prob. 2PCh. 10.5 - Prob. 3PCh. 10.5 - Prob. 4PCh. 10.5 - Prob. 5PCh. 10.5 - Prob. 6PCh. 10.5 - Prob. 7PCh. 10.5 - Prob. 8PCh. 10.5 - Prob. 9PCh. 10.6 - Prob. 1PCh. 10.6 - Prob. 2PCh. 10.6 - Prob. 3PCh. 10.6 - Prob. 4PCh. 10.6 - Prob. 5PCh. 10.6 - Prob. 6PCh. 10.6 - Prob. 7PCh. 10 - Prob. 1CRPCh. 10 - Prob. 2CRPCh. 10 - Prob. 3CRPCh. 10 - Prob. 4CRPCh. 10 - Prob. 5CRPCh. 10 - Before you solve Problems 514, first classify the...Ch. 10 - Prob. 7CRPCh. 10 - Prob. 8CRPCh. 10 - Prob. 9CRPCh. 10 - Prob. 10CRPCh. 10 - Prob. 11CRPCh. 10 - Prob. 12CRPCh. 10 - Prob. 13CRPCh. 10 - Prob. 14CRPCh. 10 - Prob. 1DHCh. 10 - Prob. 1LCCh. 10 - Prob. 2LCCh. 10 - Prob. 1UTCh. 10 - Prob. 2UTCh. 10 - Prob. 3UT
Knowledge Booster


Learn more about
Need a deep-dive on the concept behind this application? Look no further. Learn more about this topic, statistics and related others by exploring similar questions and additional content below.Similar questions
- Question 1 For the following scenarios provide the following: • the null and alternative hypotheses • explain whether the hypothesis test is left-tailed, right-tailed, or two-tailed, • explain how you should interpret a decision that rejects the null hypothesis, and • explain how you should interpret a decision that fails to reject the null hypothesis. a. A meal supplement provider claims that the average difference in calories between two brands is 55.arrow_forwardQuestions 6–10 refer to the sample data in the following table, which describes the fate of the passengers and crew aboard the Titanic when it sank on April 15, 1912. Assume that the data are a sample from a large population and we want to use a 0.05 significance level to test the claim that surviving is independent of whether the person is a man, woman, boy, or girl. Identify the null and alternative hypotheses corresponding to the stated claim.arrow_forwardThe closer the numerator of a t-test gets to zero, the more likely it is that there is no statistically significant difference between the two means we are testing. True Falsearrow_forward
- In the picture there is a given data and based from that data. There is no significant difference between the perceived level of riskiness of thrill behavior in males and in females. (Use a= 0.05) Identify the Null hypothesis and Alternative Hypothesisarrow_forwardIf your question is that your significant hypothesis test is significant “enough” to have true meaning, what are some other things you can look at to determine practical significance?arrow_forwardIf the proportion of the population in City A that is over 65 years old is p1 and the proportion of the population in City B that is over 65 years old is p2, what is the null hypothesis for a test to determine if the proportion of the population that is over 65 years old is greater in City A? Select the correct answer below: H0: p1−p2=0 H0: p1−p2>0 H0: p1−p2<0 H0: p1−p2≠0arrow_forward
- For all problems provide the following as warranted. SHOW ALL WORK: Null hypothesis; Alternative hypothesis; appropriate variables such as variance, sample mean etc; a sketch of the normal distribution curve with the appropriate critical value(s), critical (reject) area(s), and test value shown; a written statement on whether the null hypothesis is to be reject based on the provided evidence. Please ask for clarification on these directions if needed. 3) The number of students who belong to the dance company at each of several randomly selected small universities is shown here. Estimate the true population mean size of a university dance company with 99% confidence.21 25 32 22 28 30 29 30 40 47 26 35 26 35 28 28 32 27arrow_forwardFor each of the following situations, state whether you would use a chi-square goodness-of-fit test, a chi-square test of homogeneity, a chi-square test of independence, or some other statistical test. Complete parts a) through c) below. a) Is the quality of a car affected by what day it was built? A car manufacturer examines a random sample of the warranty claims filed over the past two years to test whether defects are randomly distributed across days of the work week. Choose the correct answer below. A. Chi-square test of independence. You have data on two variables, day and quality, for one manufacturer. B. Chi-square goodness-of-fit test. You want to see if the distribution of defects is uniform over the variable day. C. Chi-square test of homogeneity. You have two samples and one variable, day. You want to see if the distribution of quality is the same in the two years. D. Some other statistical test. The variable day is…arrow_forwardFor the following pairs of assertions, indicate which do not comply with our rules for setting up hypotheses and why (the subscripts 1 and 2 differentiate between quantities for two different populations or samples):arrow_forward
- We want to compare cholesterol levels between men and women, so we collect a sample of 20 women and 30 men. The group of men in our sample have a mean of 240.0 with standard deviation 35.0, and the women have a mean of 210.0 with standard deviation 30.0. What is the null hypothesis? Note that two-sample problems (like this one) were not discussed in class, but you should know the answer (or at least be able to provide a good guess below) based on what was covered in class. Group of answer choices The mean cholesterol level in men is equal to the mean cholesterol level in women The mean cholesterol level in men is different than the mean cholesterol level in women The mean cholesterol level in men is less than the mean cholesterol level in women The mean cholesterol level in men is less than the mean cholesterol level in womenarrow_forwardFor each of the following hypothetical analyses, decide whether the appropriate test is binomial, goodness of fit, or independence. Then give the appropriate null and alternative hypothesis in words. (Note that binomial tests can be considered a special form of GOF, but if the binomial test can be performed, call it binomial and render the null and alternative hypotheses in symbols, instead.) a) Respondents to a survey indicate whether they Agree, Disagree, or Don’t Know that a carbon tax would help reduce greenhouse gas emissions. A researcher wants to know if such opinions are affected by what political party people belong to. b) At hospital births, the attendant rates the newborn 1 minute after birth with a number called the Apgar score, on a scale of 1 to 10. Scores of 7 or above are considered normal, and scores of 6 or below indicate that babies need immediate medical attention, such as airway clearance. Suppose you wish to test the proposition that the race of the mother does…arrow_forwardNeed answers for these questions . Using the Chi-square statistical tablearrow_forward
arrow_back_ios
SEE MORE QUESTIONS
arrow_forward_ios
Recommended textbooks for you
 MATLAB: An Introduction with ApplicationsStatisticsISBN:9781119256830Author:Amos GilatPublisher:John Wiley & Sons Inc
 Probability and Statistics for Engineering and th...StatisticsISBN:9781305251809Author:Jay L. DevorePublisher:Cengage Learning
 Statistics for The Behavioral Sciences (MindTap C...StatisticsISBN:9781305504912Author:Frederick J Gravetter, Larry B. WallnauPublisher:Cengage Learning
 Elementary Statistics: Picturing the World (7th E...StatisticsISBN:9780134683416Author:Ron Larson, Betsy FarberPublisher:PEARSON
 The Basic Practice of StatisticsStatisticsISBN:9781319042578Author:David S. Moore, William I. Notz, Michael A. FlignerPublisher:W. H. Freeman
 Introduction to the Practice of StatisticsStatisticsISBN:9781319013387Author:David S. Moore, George P. McCabe, Bruce A. CraigPublisher:W. H. Freeman
MATLAB: An Introduction with Applications
Statistics
ISBN:9781119256830
Author:Amos Gilat
Publisher:John Wiley & Sons Inc
Probability and Statistics for Engineering and th...
Statistics
ISBN:9781305251809
Author:Jay L. Devore
Publisher:Cengage Learning
Statistics for The Behavioral Sciences (MindTap C...
Statistics
ISBN:9781305504912
Author:Frederick J Gravetter, Larry B. Wallnau
Publisher:Cengage Learning
Elementary Statistics: Picturing the World (7th E...
Statistics
ISBN:9780134683416
Author:Ron Larson, Betsy Farber
Publisher:PEARSON
The Basic Practice of Statistics
Statistics
ISBN:9781319042578
Author:David S. Moore, William I. Notz, Michael A. Fligner
Publisher:W. H. Freeman
Introduction to the Practice of Statistics
Statistics
ISBN:9781319013387
Author:David S. Moore, George P. McCabe, Bruce A. Craig
Publisher:W. H. Freeman
Hypothesis Testing using Confidence Interval Approach; Author: BUM2413 Applied Statistics UMP;https://www.youtube.com/watch?v=Hq1l3e9pLyY;License: Standard YouTube License, CC-BY
Hypothesis Testing - Difference of Two Means - Student's -Distribution & Normal Distribution; Author: The Organic Chemistry Tutor;https://www.youtube.com/watch?v=UcZwyzwWU7o;License: Standard Youtube License