
Modern Business Statistics with Microsoft Excel (MindTap Course List)
5th Edition
ISBN: 9781285433301
Author: David R. Anderson, Dennis J. Sweeney, Thomas A. Williams
Publisher: Cengage Learning
expand_more
expand_more
format_list_bulleted
Videos
Textbook Question
Chapter 10.2, Problem 14E
Are nursing salaries in Tampa, Florida, lower than those in Dallas, Texas? As reported by the Tampa Tribune, salary data show staff nurses in Tampa earn less than staff nurses in Dallas. Suppose that in a follow-up study of 40 staff nurses in Tampa and 50 staff nurses in Dallas you obtain the following results.
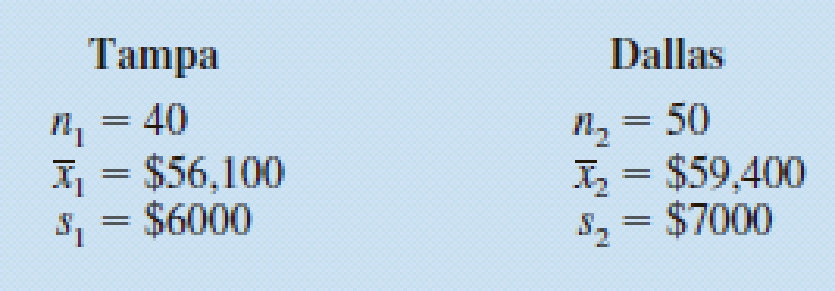
- a. Formulate a hypothesis so that, if the null hypothesis is rejected, we can conclude that salaries for staff nurses in Tampa are significantly lower than for those in Dallas. Use α = .05.
- b. What is the value of the test statistic?
- c. What is the p-value?
- d. What is your conclusion?
Expert Solution & Answer

Trending nowThis is a popular solution!

Students have asked these similar questions
We are intrested in predicting the percentage of people commuting to work by walking given some input variables. Each observation corresponds to a different city and each input variable summarizes some characteristic of a given city, such as density, urban sprawl and average income per capita. This is
1.
not a machine learning problem. Only social scientists would be interested in such a problem.
2.
both a classification and a regression problem as it depends on the way one codes the output variable as either 0, 1 or a a particular number in the [0,1] interval.
3.
a regression problem. The output variable is continuous.
4.
a classification problem. Walking to work is a discrete variable and can only take two values: to walk to work and not to walk to wor
Joan believes that half of first-time brides in Singapore are younger than their grooms. Joansamples 100 first-time brides and 53 reply that they are younger than their grooms. If she performsa hypothesis test at 1% level of significance, what can she conclude?
Tuition($)
Applicant Pool
Applicant
950
76210
11040
1225
78000
10940
1325
67420
8670
1350
70380
9040
1500
62580
7410
1675
59260
7080
1800
57930
6350
1975
60130
6110
a.develop the multiple regression equation for these data.
b. What is the coefficient of determination for this regression equation?
c. Determine the forecast for freshman applicants for a tuition rate of $1700 per semester, with a pool of applicants of 63000.
CAN YOU SHOW ME ALL THE ANSWER STEP STEP WİTH EXCELL
Chapter 10 Solutions
Modern Business Statistics with Microsoft Excel (MindTap Course List)
Ch. 10.1 - The following results come from two independent...Ch. 10.1 - 2. Consider the following hypothesis test.
The...Ch. 10.1 - 3. Consider the following hypothesis test.
The...Ch. 10.1 - 4. Condé Nast Traveler conducts an annual survey...Ch. 10.1 - 5. The USA Today reports that the average...Ch. 10.1 - Hotel Price Comparison. Suppose that you are...Ch. 10.1 - Consumer Reports uses a survey of readers to...Ch. 10.1 - Prob. 8ECh. 10.2 - The following results are for independent random...Ch. 10.2 - Consider the following hypothesis test:
The...
Ch. 10.2 - Consider the following data for two independent...Ch. 10.2 - Prob. 12ECh. 10.2 - Annual Cost of College. The increasing annual cost...Ch. 10.2 - Are nursing salaries in Tampa, Florida, lower than...Ch. 10.2 - Prob. 15ECh. 10.2 - Effect of Parents’ Education on Student SAT...Ch. 10.2 - Comparing Financial Consultant Ratings....Ch. 10.2 - Researchers at Purdue University and Wichita State...Ch. 10.3 - Consider the following hypothesis test.
The...Ch. 10.3 - The following data are from matched samples taken...Ch. 10.3 - Prob. 21ECh. 10.3 - The price per share of stock for a sample of 25...Ch. 10.3 - Credit Card Expenditures. Bank of America’s...Ch. 10.3 - Domestic Airfare. The Global Business Travel...Ch. 10.3 - Prob. 25ECh. 10.3 - PGA Tour Scores. Scores in the first and fourth...Ch. 10.3 - Price Comparison of Smoothie Blenders. A personal...Ch. 10.4 - Consider the following results for independent...Ch. 10.4 - Prob. 29ECh. 10.4 - Corporate Hiring Outlook. A Businessweek/Harris...Ch. 10.4 - Prob. 31ECh. 10.4 - Prob. 32ECh. 10.4 - Chicago OHare and Atlanta Hartsfield-Jackson are...Ch. 10.4 - Prob. 34ECh. 10.4 - In a test of the quality of two television...Ch. 10.4 - Winter visitors are extremely important to the...Ch. 10.4 - Prob. 37ECh. 10 - Prob. 38SECh. 10 - Prob. 39SECh. 10 - Prob. 40SECh. 10 - Kitchen Versus Bedroom Remodeling Costs. The...Ch. 10 - In early 2009, the economy was experiencing a...Ch. 10 - Country Financial, a financial services company,...Ch. 10 - Prob. 44SECh. 10 - Prob. 45SECh. 10 - Prob. 46SECh. 10 - For the week ended January 15, 2009, the bullish...
Knowledge Booster


Learn more about
Need a deep-dive on the concept behind this application? Look no further. Learn more about this topic, statistics and related others by exploring similar questions and additional content below.Similar questions
- Question 12In linear regression to satisfy cost function equals to zero, then the hypothesis function h(x) will equal to y from the training set. True Falsearrow_forwardpropose a dataset to execute multivariate linear regression. The dataset must contain one dependent variable and at least 3 independent variables. Include your source. The data must not exceed 300. By using MATLAB,Solve for the simple linear regression formula for each independent variable (e.g., ? = ?1?1, ? = ?2?2, …). Include the calculation for error. Which variable do you think correlates the best, and which is the worst?arrow_forwardThe brown-eyed man from the previous question also has kids with a woman with brown eyes, whose whole family for the past 10 generations had brown eyes. What percentage of their children can be expected to have blue eyes? a. 0% b. 25% c. 50% d. 75% e. 100%arrow_forward
- The report from the hospital said a study following a group of 250 girls found those ____ Were fatter at 3 age 3 and ____ gained welght dung the next three years reached puberty by age 9 a) © who / which b) © which / whose c) © thark whom d) who / that e) which / whoarrow_forwardAssume that your hypothesis function is of the form f(x) = w0 + w1x and that the current values of w0 and w1 are 1 and 2 respectively. Further assume that you are using a learning rate (alpha) of 0.001 What is the gradient update for w0 (only the change) associated with the point (1, 12)?arrow_forwardQuestion 4 A university received 1000 applications for the undergraduate program every semester. Of all applicants, 150 had a CGPA score above 3.70. 520 applicants had a CGPA score between 3.50 and 3.70. 100 applicants had a score between 3.00 and 3.50. All other applicants had a score lower than 3.00. What probability will a randomly selected applicant have a score lower than 3.00? If this semester, the total of students who get the CGPA score lower than 3.00 is 20% of the total student received, and the number of the other students who get CGPA above 3.50 is the same. Find the number of students who get CGPA between 3.00 and 3.50?arrow_forward
- What is the code in Stata for this question? Run the linear regression given by wages = β0 +β1education+β2workexp+β3unionmember +β4south+ β5−9occupation + β10female + u where wages=hourly wage in US dollars; education=years of schooling; workexp=years of work experience; unionmember=a dummy variable equal to ”1” if a person is a union member, and ”0” otherwise; south=a dummy variable equal to ”1” if a person lives in the south, and ”0” otherwise; occupation=a categorical variable equal to ”1” if a person’s occupation is ”management”; ”2” if it is ”sales”; ”3” if it is ”clerical”, ”4” if it is ”service”, ”5” if it is ”professional” and ”6” if it is ”other”. Please make sure to use ”other” as the base category; female =a dummy variable equal to ”1” if a person is female, and ”0” if a person is male.arrow_forwardAssuming a total sample of 1079 persons, among which 520 persons are having autism and 559 are healthy persons. When we pass the data of 520 autism patients into the KNN classifier, it correctly predicted “220” patients as autism category and the remaining patients into healthy category. Similarly, from 559 healthy persons, the KNN categorize “100” as autism patients and the remaining as healthy persons. In the above scenario, if “autism” is considered as “positive class” and “healthy person” is considered as negative class then find the: True Positive True Negative False Positive False Negative Sensitivity (True positive rate) Specificity (True negative rate) Accuracy Precisionarrow_forwardAssuming a total sample of 1079 persons, among which 520 persons are having autism and 559 are healthy persons. When we pass the data of 520 autism patients into the KNN classifier, it correctly predicted “220” patients as autism category and the remaining patients into healthy category. Similarly, from 559 healthy persons, the KNN categorize “100” as autism patients and the remaining as healthy persons. In the above scenario, if “autism” is considered as “positive class” and “healthy person” is considered as negative class then find the: True Positive True Negative False Positive False Negative Sensitivity (True positive rate) Specificity (True negative rate) Accuracy Precision Draw the confusion matrix Assuming a total sample of 1079 persons, among which 520 persons are having autism and 559 are healthy persons. When we pass the data of 520 autism patients into the KNN classifier, it correctly predicted “220” patients as autism category and the…arrow_forward
- 5.1.3 complete answer and solution onlt no need explanation It is suspected from theoretical considerations that the rate of water flow from a firehouse is proportional to some power of the nozzle pressure. Assume pressure data is more accurate. You are transforming the data. F 96 129 135 145 168 235 p 11 17 20 25 40 55 What is the exponent of the nozzle pressure in the regression model F = apb?arrow_forwardIf a man (blood genotype IAi) and a women (blood genotype IBi) have children, which of the following are possible genotypes for their offspring? Select all that apply. IAIB IAi IBi i iarrow_forwardYou have been hired by the European Space Agency to build a model that predicts the amount of oxygen that an astronaut consumes when performing five minutes of intense physical work. The descriptive features for the model will be the age of the astronaut and their average heart rate throughout the work. The regression model is OXYCON = w[0] + w[1] × AGE + w[2] × HEARTRATEarrow_forward
arrow_back_ios
arrow_forward_ios
Recommended textbooks for you
 Operations Research : Applications and AlgorithmsComputer ScienceISBN:9780534380588Author:Wayne L. WinstonPublisher:Brooks Cole
Operations Research : Applications and Algorithms
Computer Science
ISBN:9780534380588
Author:Wayne L. Winston
Publisher:Brooks Cole
Hypothesis Testing using Confidence Interval Approach; Author: BUM2413 Applied Statistics UMP;https://www.youtube.com/watch?v=Hq1l3e9pLyY;License: Standard YouTube License, CC-BY
Hypothesis Testing - Difference of Two Means - Student's -Distribution & Normal Distribution; Author: The Organic Chemistry Tutor;https://www.youtube.com/watch?v=UcZwyzwWU7o;License: Standard Youtube License